Over the past year, I’ve received almost countless requests to review the Airthings View Plus air quality monitor. I’m not quite sure what has led to its popularity – perhaps it’s the brand, as Airthings is well known, or perhaps it’s because most outlets highly review this monitor. Either way, this monitor came across my radar due to the consistent requests I get to test it.
After finally getting my hands on the Airthings View Plus a few weeks ago, I’ve been using it daily. Now, I feel like I have spent enough time with it to provide a complete, in-depth review of this air quality monitor. I’ve also spent a lot of time using it in parallel with other monitors, such as the IQAir AirVisual Plus and AirGradient ONE, so I can fully understand the ins and outs of this monitor and how it performs compared to other monitors I’ve recently tested.
While I know that this monitor has Alexa support for smart home integration, I haven’t had a chance to test this aspect of the monitor as I’m not in Amazon’s ecosystem. Instead, my time with this monitor has mostly been spent travelling and using the monitor in a range of hotels and on the go. However, I have also spent about two weeks accuracy testing it in the apartment that I’m currently staying in.
All of this is to say that I’ve used the monitor in various situations – both on the go and at home. Throughout the time I’ve spent with the monitor, I’ve got a strong feel for the strengths and weaknesses of this seemingly promising monitor. So, with that said, let’s dive into those strengths and weaknesses! This is my Airthings View Plus review.
Subscribe to BreatheSafeAir
We spend 90% of our time indoors. Make sure the air you breathe indoors is healthy.
This post contains affiliate links. For more information, please refer to my affiliate disclaimer. I was NOT sent a product for review; I purchased this monitor myself. All opinions expressed in this post are my honest thoughts. I only recommend products that I believe in.
Information on this blog is for informational purposes only. Readers are encouraged to confirm the information herein with other sources. Furthermore, this information is not intended to replace medical advice from professionals. This website assumes no responsibility for the accuracy of the information, which is subject to change without notice. Devices mentioned on this website are not medical devices and do not guarantee protection.
Accuracy & Sensors
The device’s accuracy is the most important aspect of any air quality monitor – and one that many reviews seem to skip completely. Since most monitors on the market use off-the-shelf sensors from companies such as Sensirion and SenseAir, we can’t discuss accuracy without first discussing the sensors used in the Airthings View Plus.
Airthings is no different in this regard, as both the Wave and View series of monitors use sensors from these and other brands. It’s important to note that this is very common, and all but the biggest budget monitors from brands such as IQAir will use off-the-shelf sensors. In fact, even the AirVisual Pro uses a SenseAir sensor, too!
So, what sensors are used in the Airthings View Plus? As per Airthing’s own documentation, they are as follows:
- CO2: CM1106SL-NS by Cubic Sensor
- PM2.5: PM2105L by Cubic Sensor
- VOCs: BME680 by Bosch Sensortec
At first glance, I was a bit disappointed with these choices as Cubic is generally considered a slightly lower-quality and, therefore, more affordable brand than SenseAir and Sensirion. This isn’t to say it’s bad, but with such a premium monitor, I would expect high-end components. Furthermore, I was disappointed that the cheaper Wave Plus uses the SenseAir Sunrise CO2 sensor, which is SenseAir’s top-of-the-line CO2 sensor, also found inside the Aranet4 Home. To me, it doesn’t make sense to have a higher-quality component in a cheaper monitor. Anyway, the Cubic sensors are far from bad, and I wanted to test them myself.
Unfortunately, I don’t have access to monitors that could be considered reference grade. Thankfully, I have access to a range of monitors which, while not reference grade, have been studied more than the Cubic Sensors and, therefore, have ample online information. For carbon dioxide accuracy tests, I compared the Airthings View Plus to two SenseAir S8 LPs, which are considered very accurate and widely proven in research. At the time, my Aranet4 Homes were being used to test the accuracy of the SCD41 inside the AIRVALENT CO2 Monitor, so I opted for the S8 LP instead.
Regarding PM2.5 accuracy, I used two Plantower PMS5003 sensors for comparison. These sensors have also been well studied, and ample research papers discuss their accuracy compared to reference monitors. While they tend to read PM10 values inaccurately, this wasn’t relevant in this comparison as the Airthings View Plus only shows PM1.0 and PM2.5 values. This is an interesting decision as the Cubic PM2105L can measure PM10 but tends to be inaccurate as PM10 concentrations are only estimated on these low-cost sensors. Anyway, I digress.
Let’s first examine the carbon dioxide sensor’s accuracy. Below is a graph of the recorded concentrations from three monitors over 60 hours of use. The monitors in question are the AirGradient Open Air, AirGradient ONE (both use SenseAir S8s), and the Airthings View Plus.
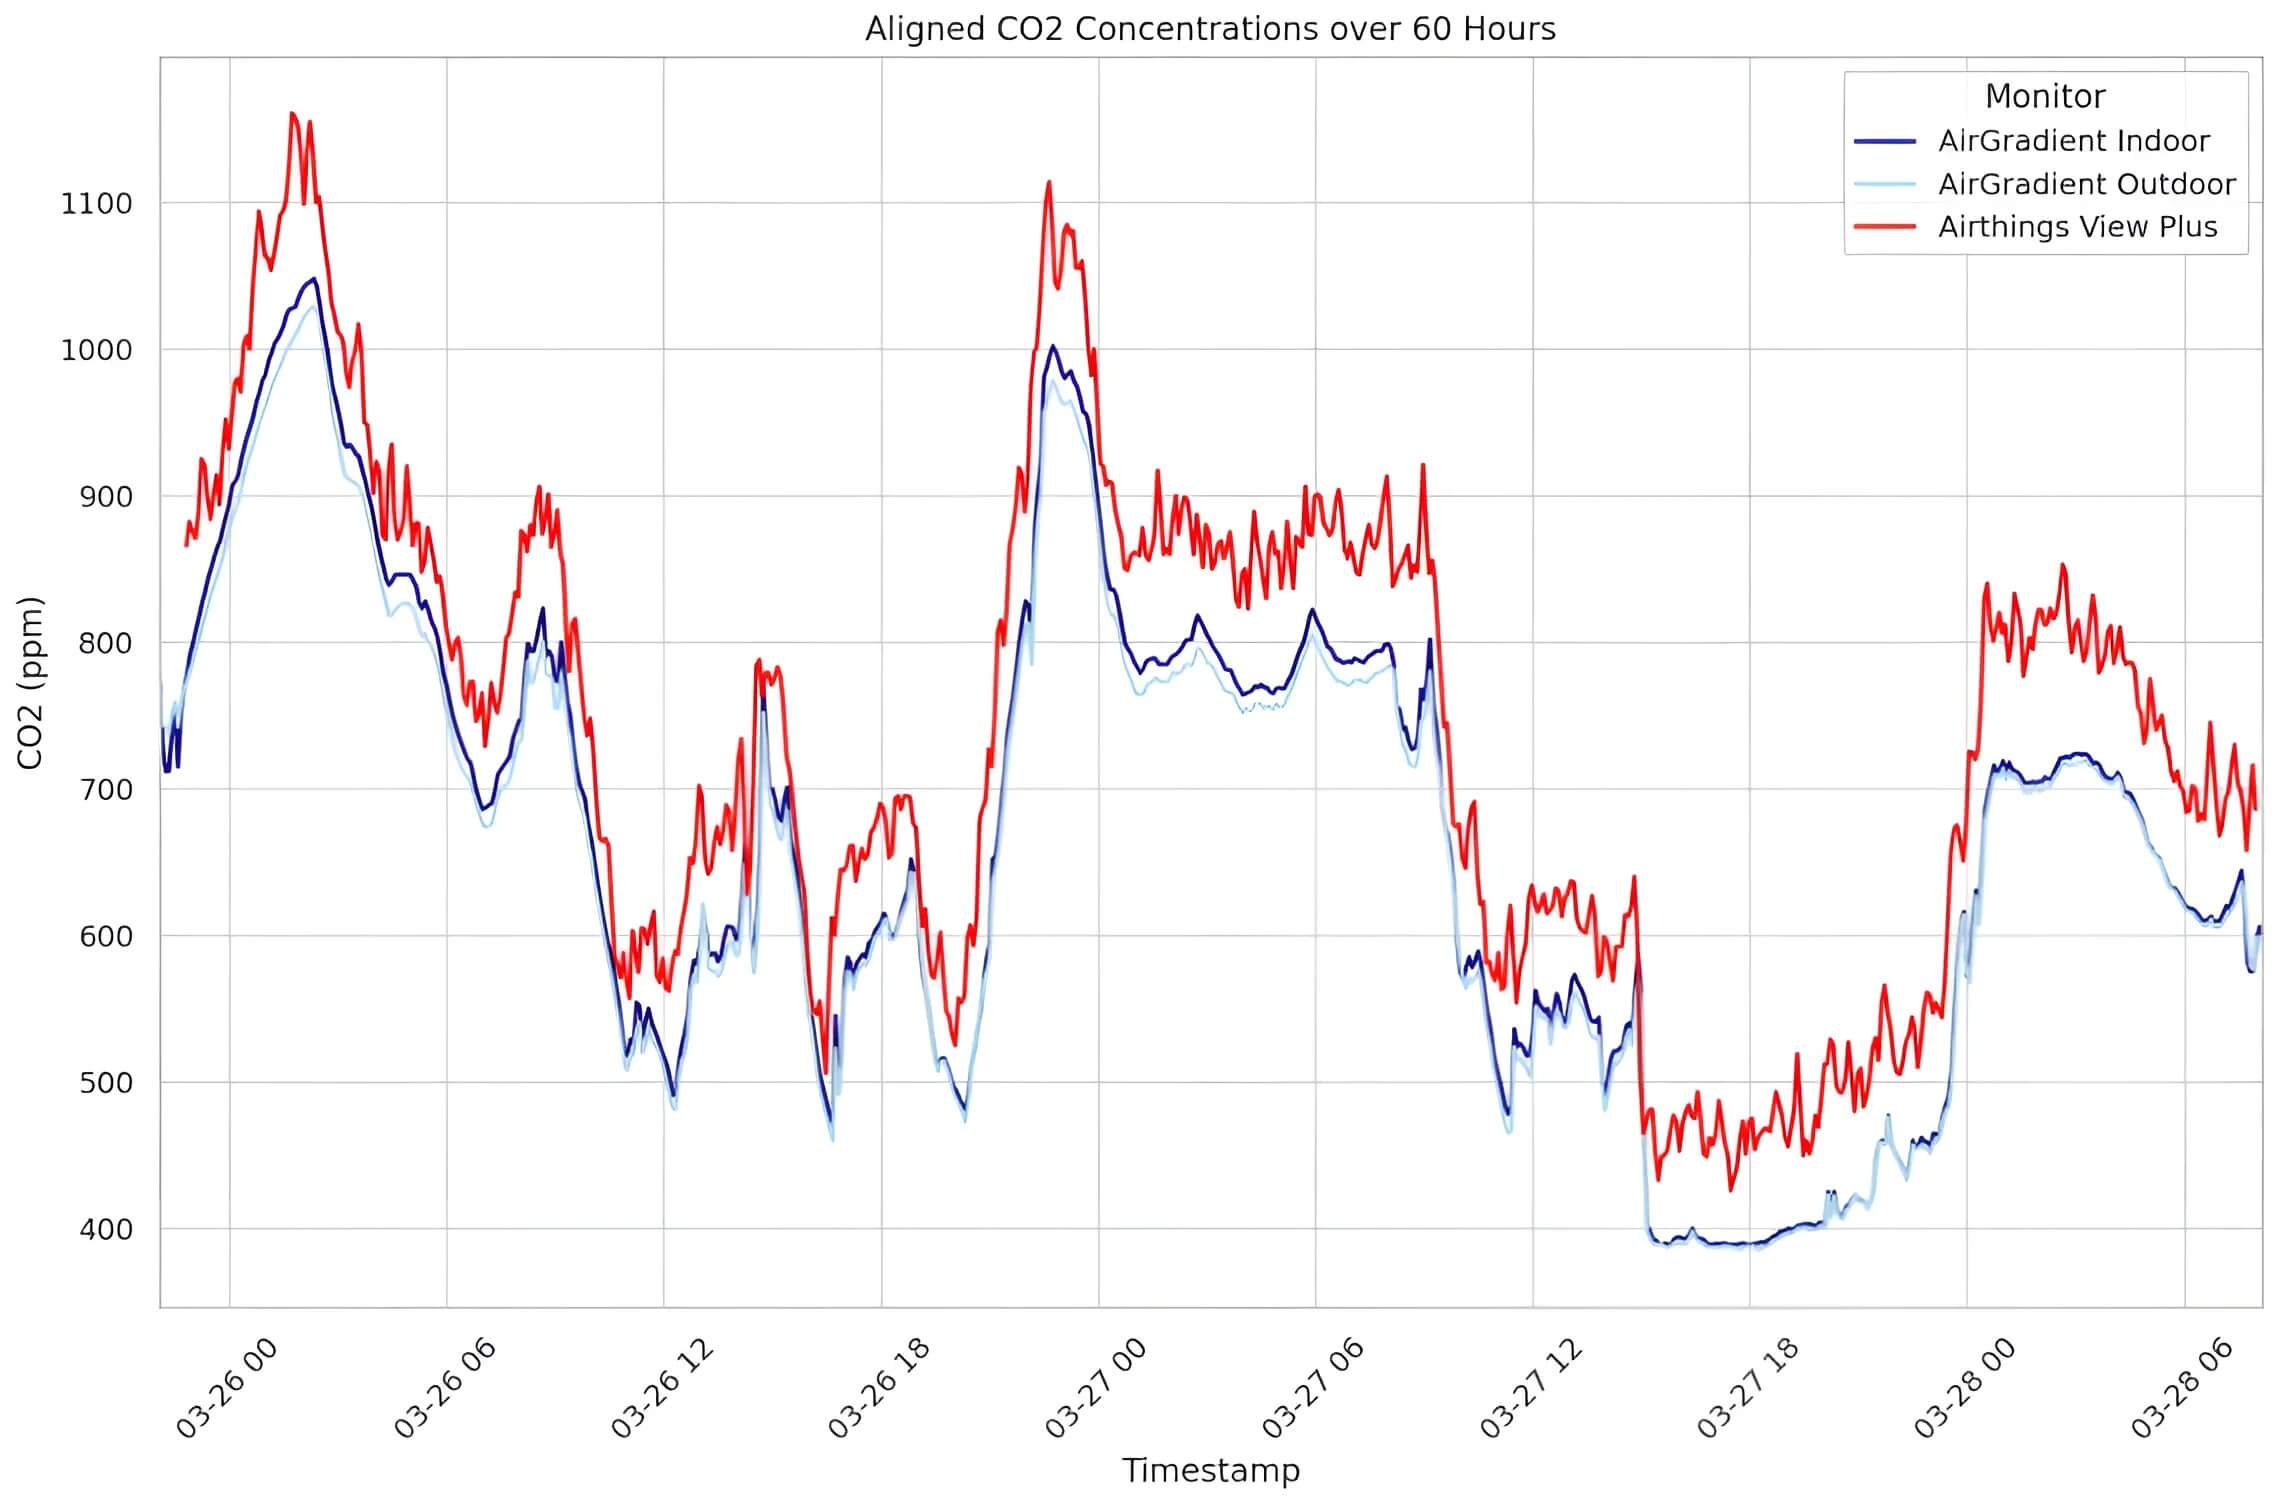
As you can see, the Cubic Sensor in the Airthings View Plus consistently reads higher than the S8s. However, the true CO2 concentration is likely somewhere between the monitors, as the S8s can also be seen reading lower than 400 at one point. Based on data from Nullschool, I would expect my ambient concentration to be around 425ppm, so the truth lies somewhere between the three lines.
You might ask why I didn’t manually calibrate the monitors and this is the first big issue with the Airthings View Plus – you can’t. There is no option on the app or web dashboard to calibrate the monitor, and even Cubic’s official documentation says that to calibrate the monitor, you should take it outside and let it sit for a while (so that automatic baseline calibration can occur). While the S8s within the two AirGradient monitors can be manually calibrated, I enabled automatic calibration and left all monitors in the same location for over a week before taking this data, as it’s more representative of what a user will experience without the ability to calibrate the monitor manually.
But what exactly is the issue with ABC (Automatic Baseline Calibration)? Put simply, the monitor will recalibrate itself based on the lowest CO2 values it recorded over seven days. This ‘feature’ is implemented to counter sensor drift, as carbon dioxide sensors drift and become less accurate over time. The issue here, though, is that not all monitors are exposed to ambient air every week. For example, if you put the monitor in your lounge where your dog resides all day when you’re at work or school, the carbon dioxide will never reach ambient levels. Let’s say that the carbon dioxide concentration in your lounge never falls below 600ppm; after a week, the sensor will believe 600ppm is 400ppm, skewing all of your future readings.
To avoid this issue, the device must be manually calibrated. Unfortunately, that isn’t possible with the Airthings View Plus. Of course, you can indirectly calibrate the device by taking it outside for a few hours and letting it automatically update its baseline, but it would be far more convenient and quicker to have a manual calibration setting within the app. I will discuss this more in the ‘app’ section of this article, but the removal of manual calibration seems like Airthing’s attempt to make this monitor as simple and straightforward to use as possible.
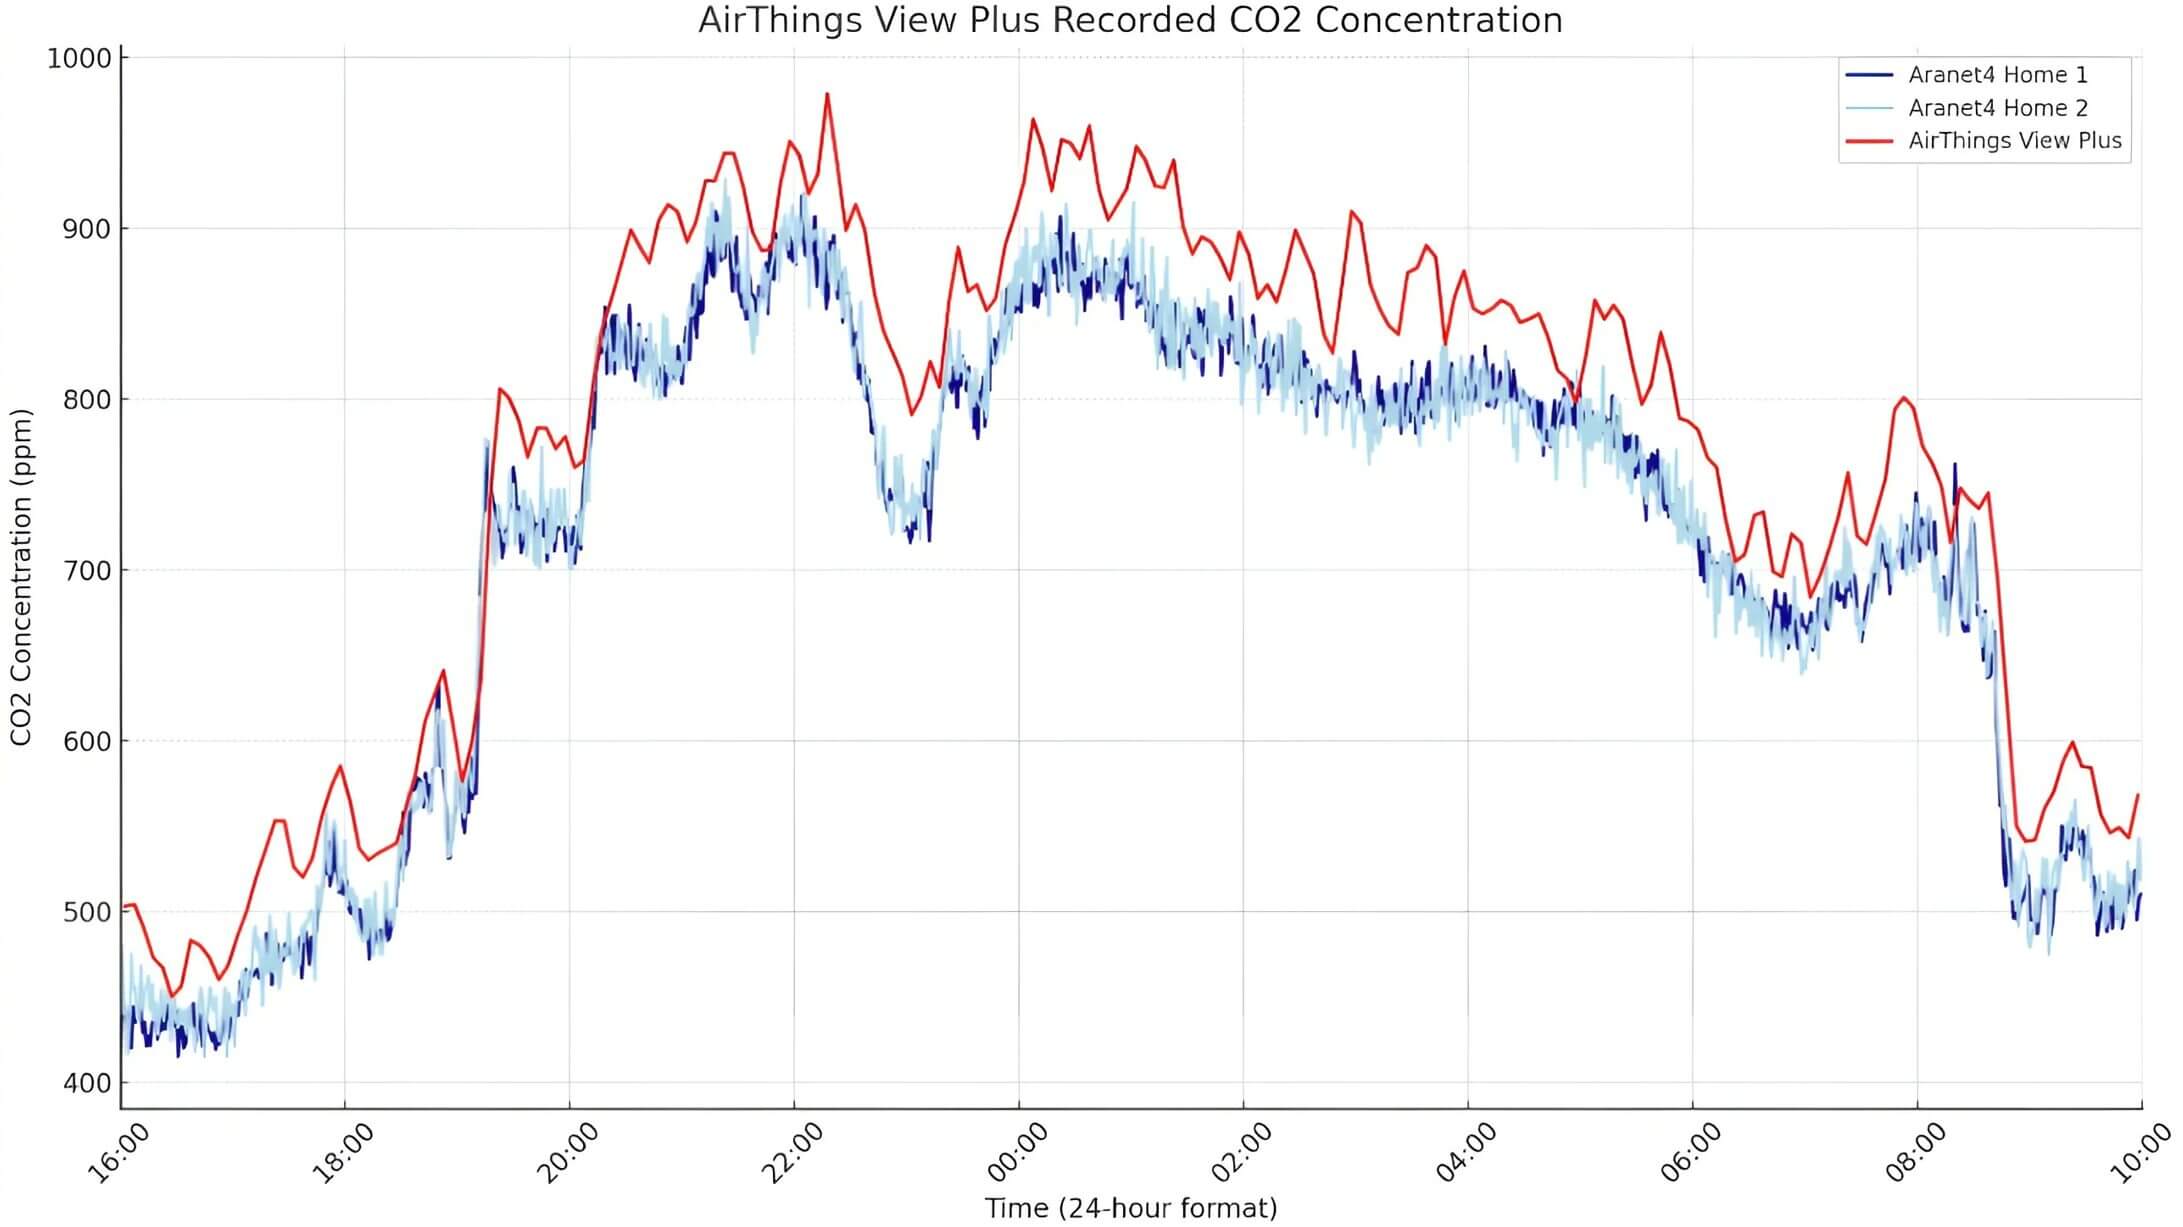
After this test, my Aranet4s were free again, and I wanted to compare the Airthings View Plus to two calibrated monitors that I knew were accurate. I was somewhat surprised to find very similar results in these tests – the Airthings View Plus read very similarly, but always higher than the two Aranet4s equipped with top-of-the-line Sunrise Sensors from SenseAir.
However, at this point, I had already begun down a rabbit hole and wanted to learn more. Carbon dioxide sensors tend to lose accuracy at higher concentrations, so I wanted to run another test at a higher but still commonly encountered concentration. To do this, I left the three monitors in my room overnight and returned with the data below.
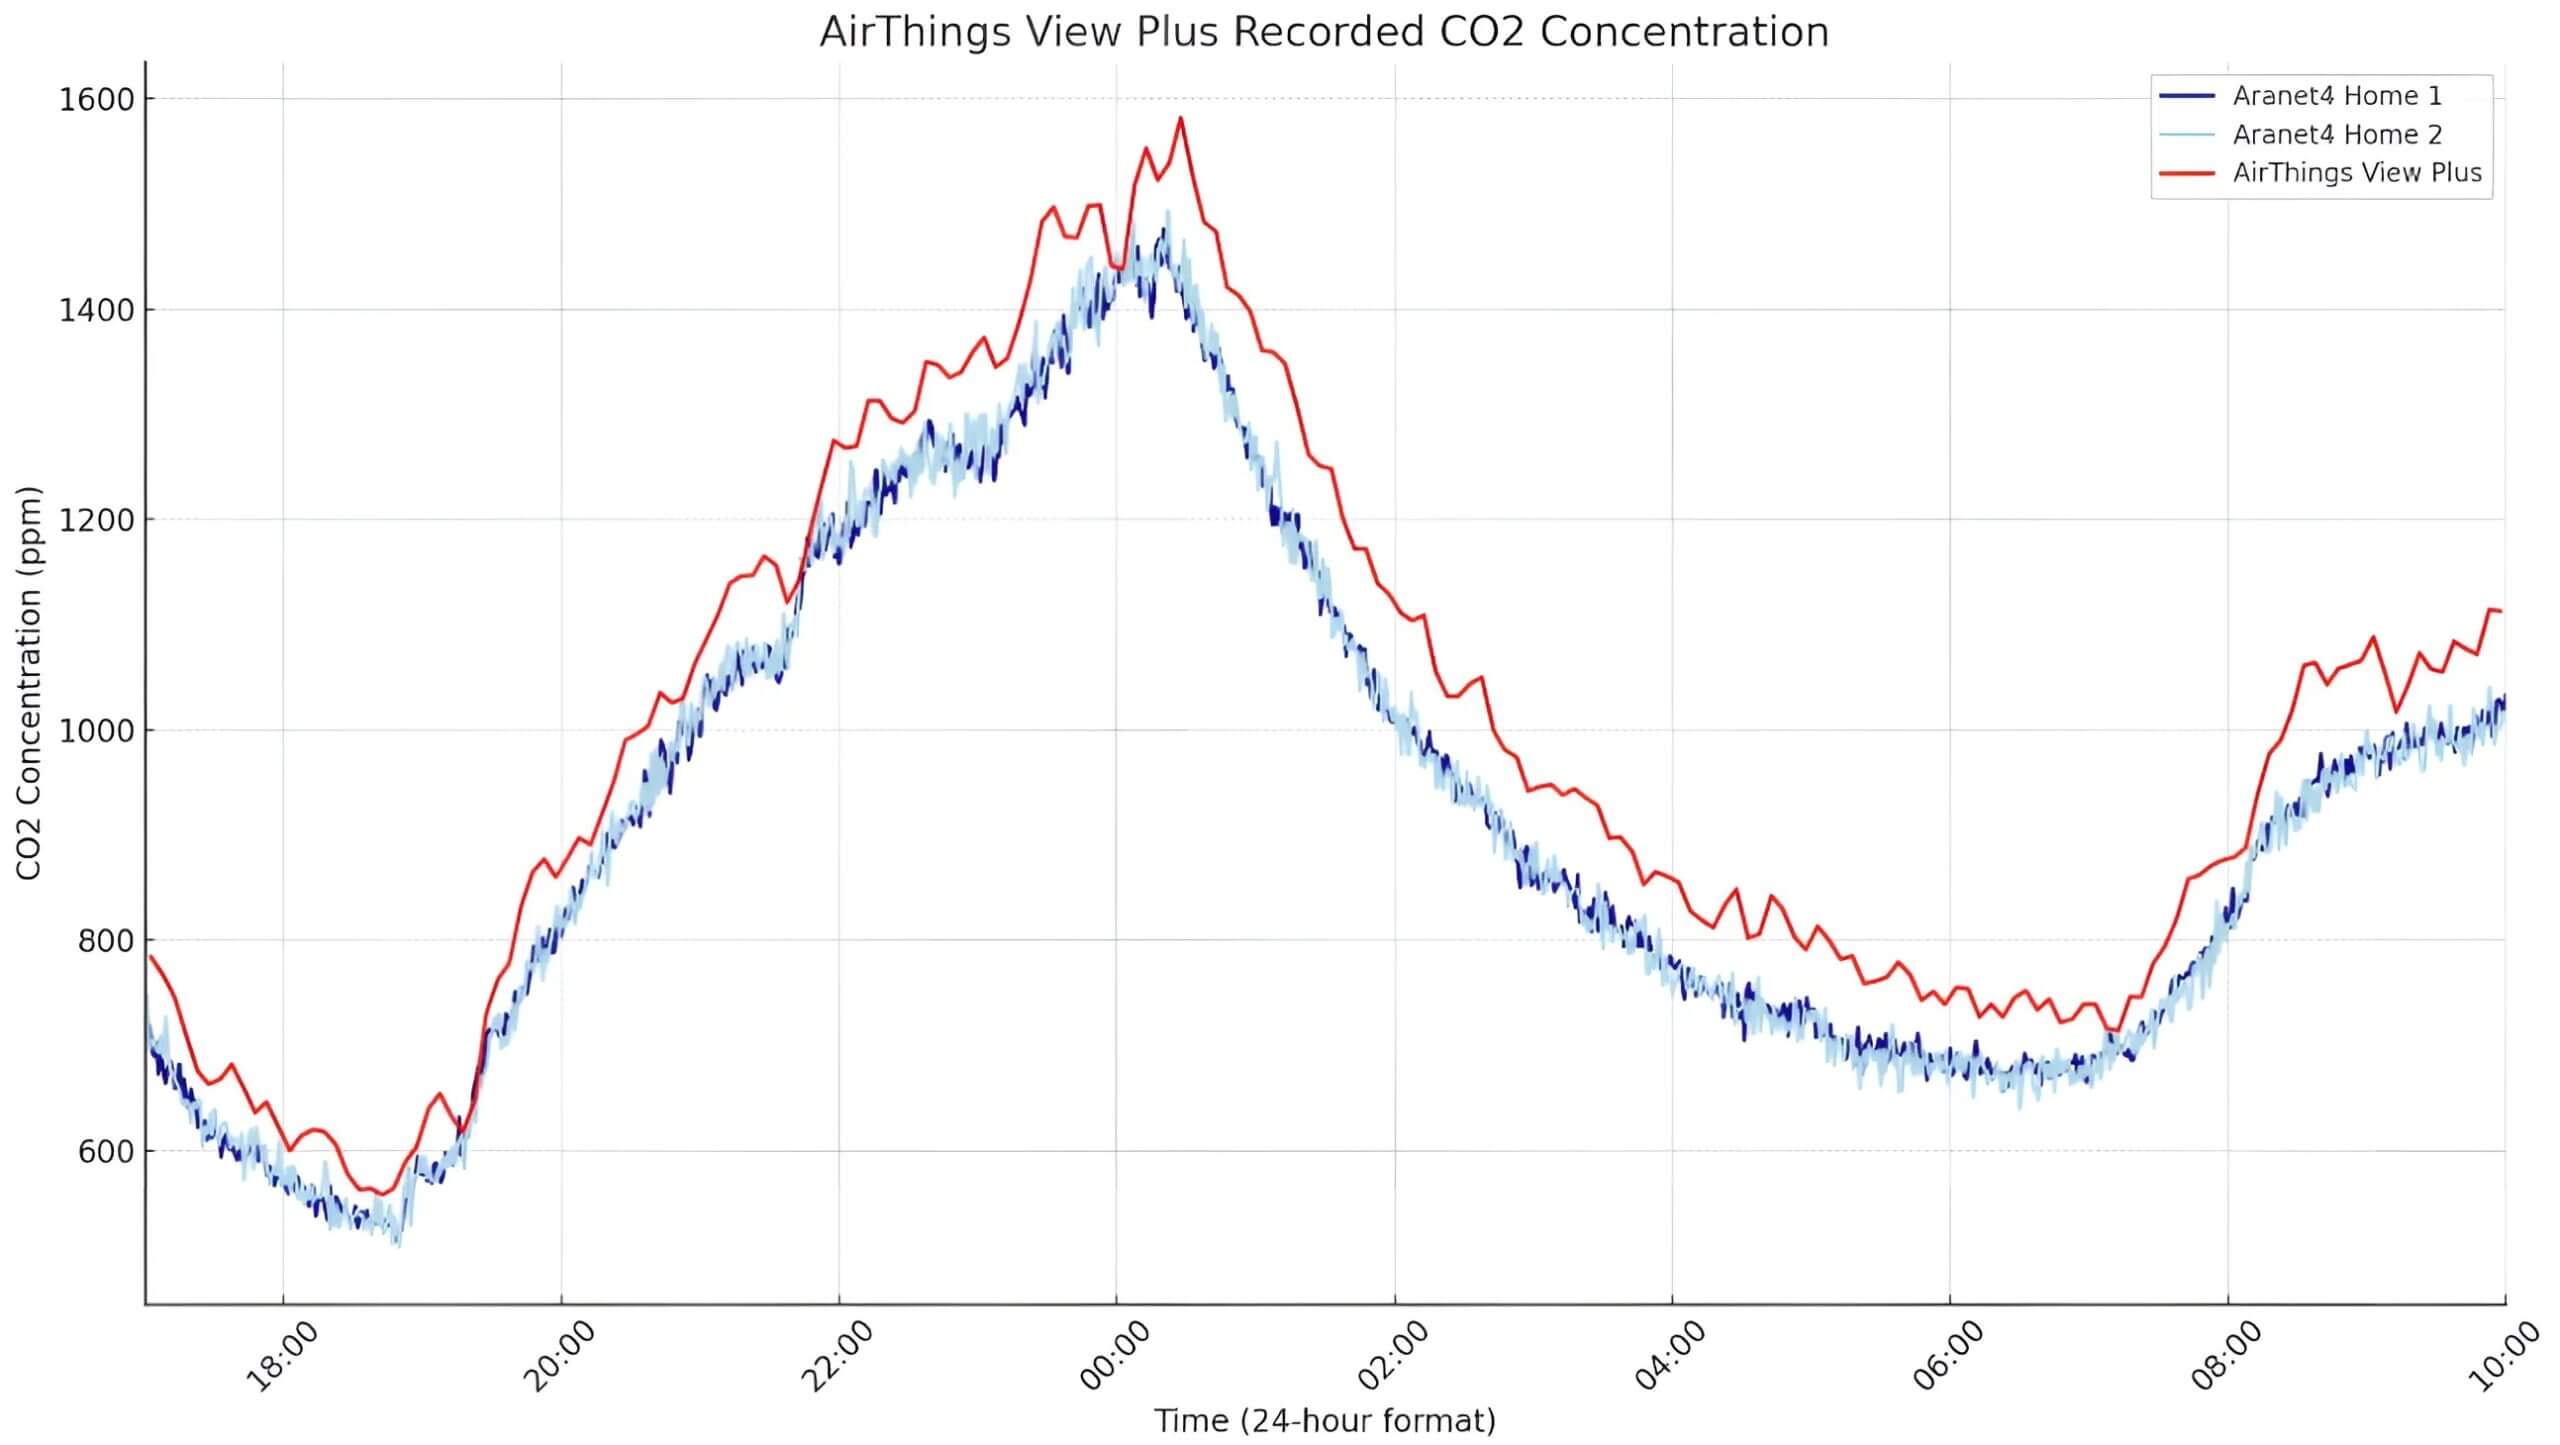
Yet again, the Airthings monitor reads consistently higher – despite being in the same locations as the Aranets for around one week before I ran these tests. However, while this trend remains consistent across all of my tests of the device, you can also see that it picks up trends very well and generally has a similar reading to both the AirGradient devices, which are equipped with SenseAir S8s and Aranet4 Homes equipped with SenseAir Sunrise sensors.
My conclusion regarding the Airthings View Plus’ CO2 accuracy is this: While the device consistently reads between 10 and 100ppm higher than other monitors, it shows a strong correlation with the other monitors and is accurate overall. However, the one big caveat here is that you must keep an eye on the autocalibration process and ensure the device is exposed to ambient air at least a few times every week.
Now, let’s take a look at the device’s PM2.5 accuracy. In this test, I compared the Airthings View Plus readings to two AirGradient monitors using Plantower PMS5003Ts, which have been proven to provide medium to high correlations with reference monitors in various studies and tests. Interestingly, all three monitors indicated similar PM2.5 concentrations, but the Airthings monitor had significantly higher peaks and more variation between readings.
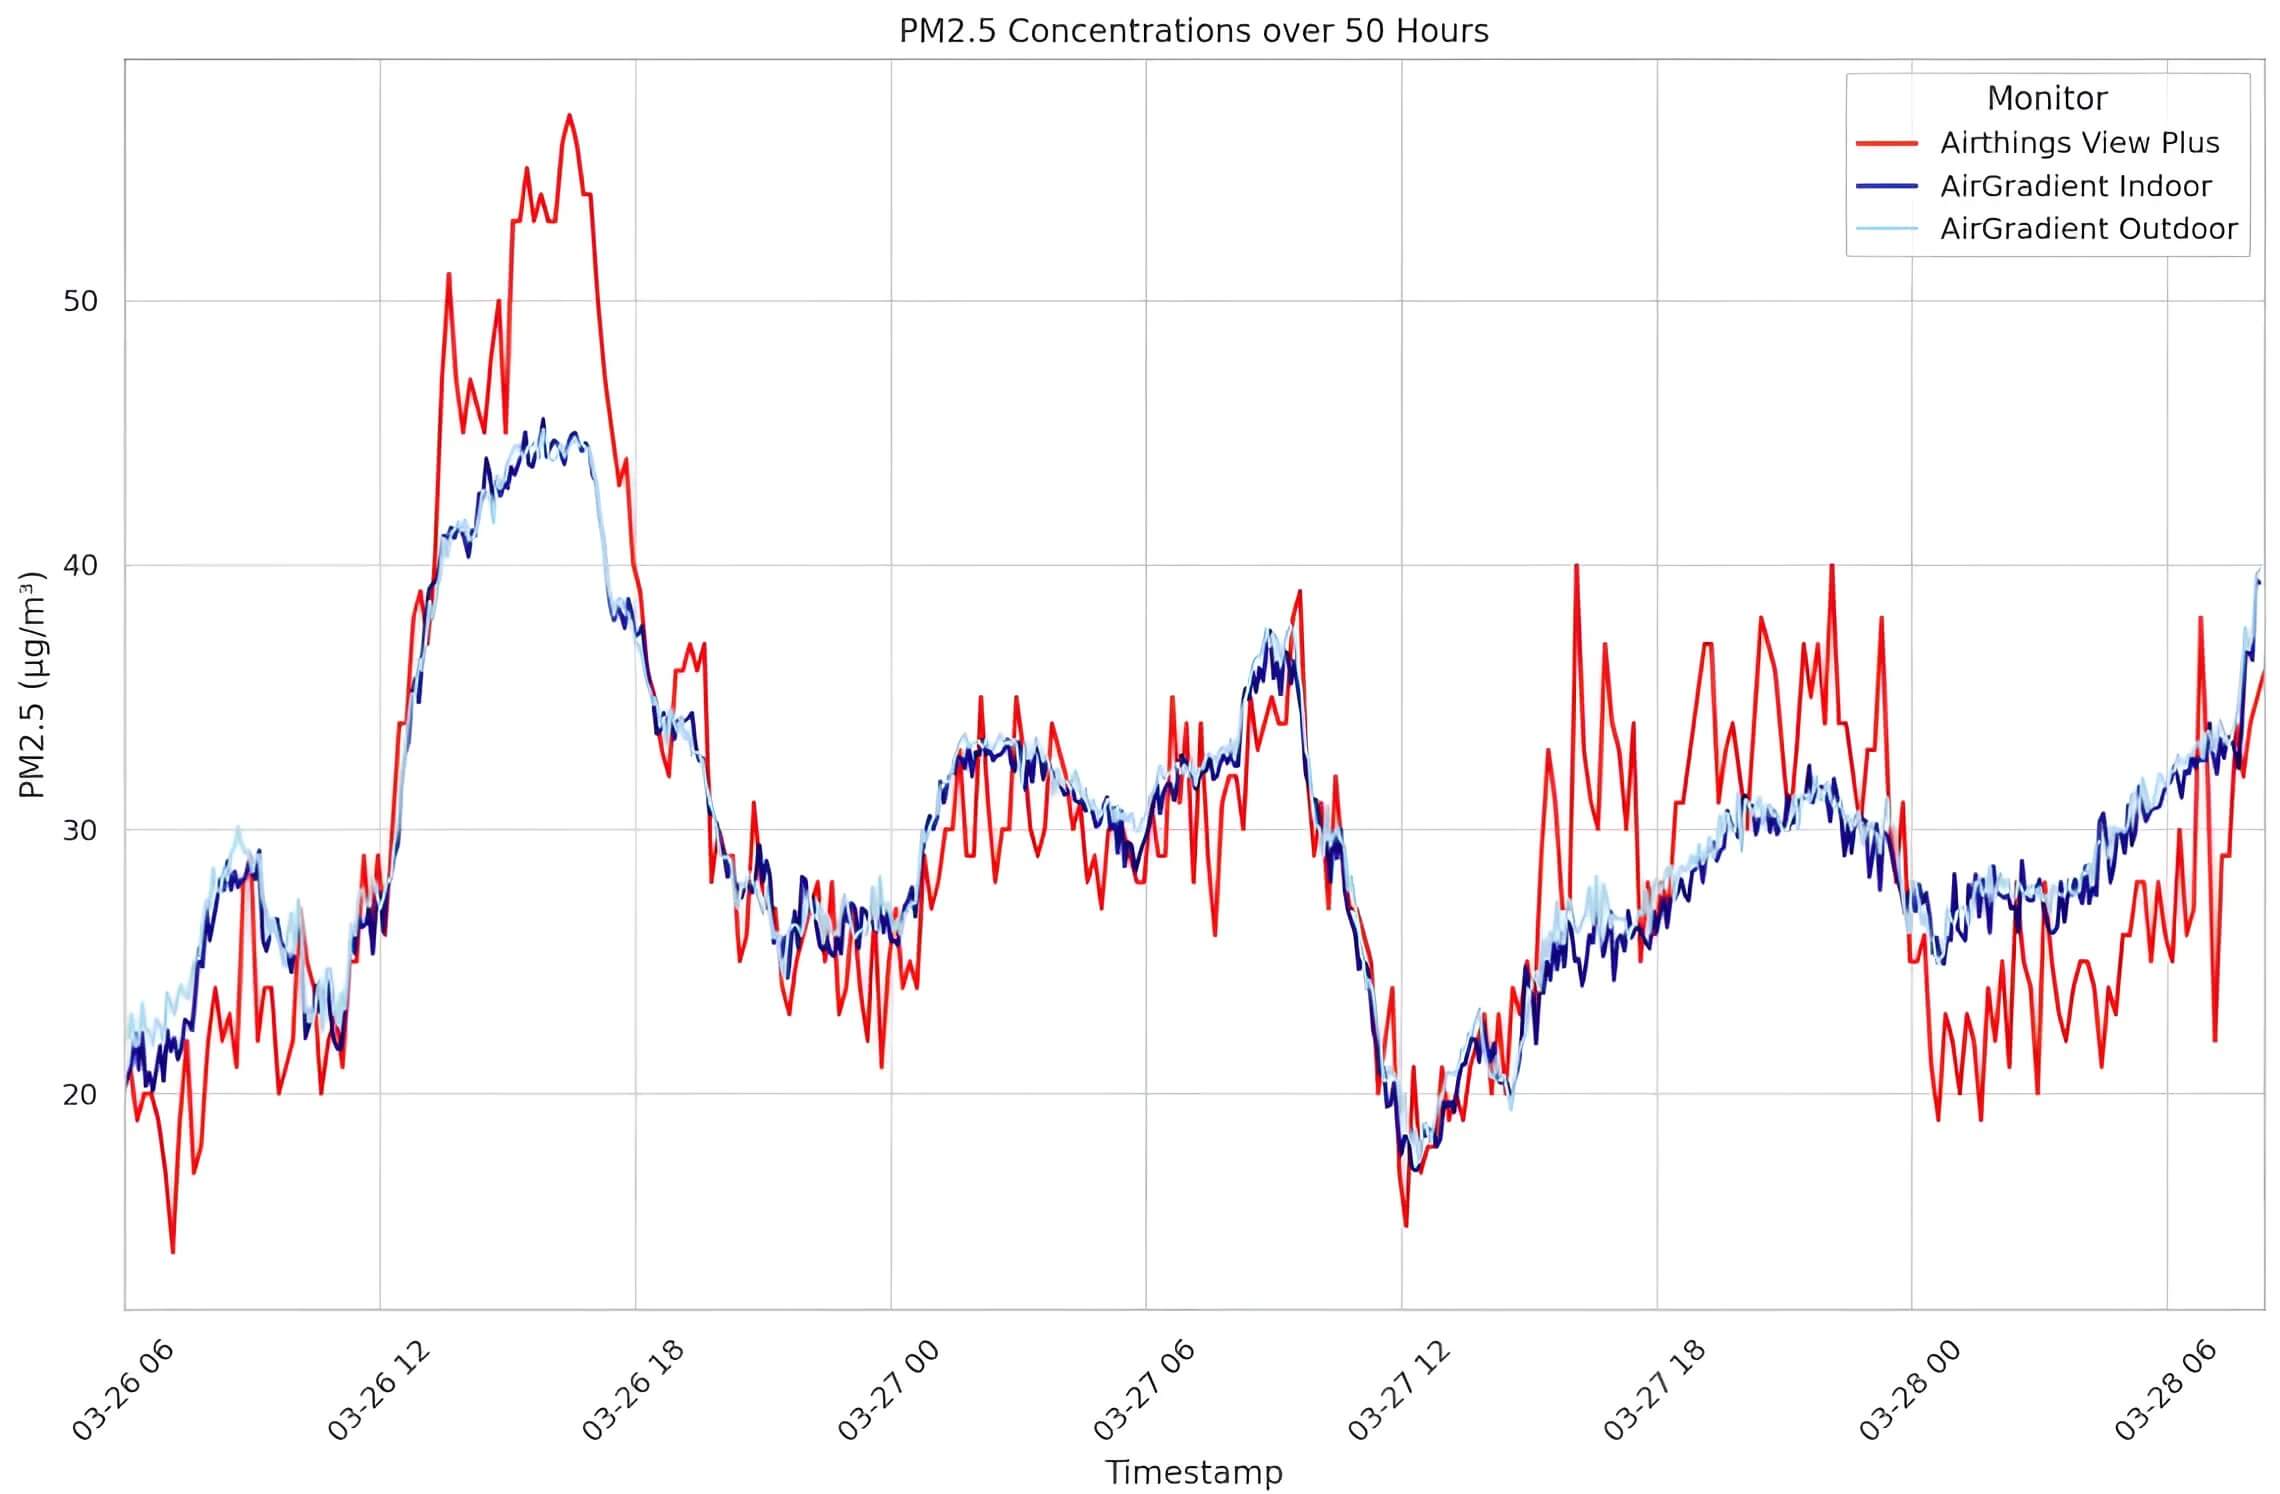
While I did look for research papers and studies discussing the accuracy of the Cubic sensor in the View Plus, I found that it’s a much less documented sensor, and I had trouble finding any solid information. As such, I relied solely on my own tests to determine accuracy here, and I feel like the device is accurate enough to be trusted. While it can increase and decrease significantly between readings, we can average the readings in any given period to get a good idea of what the PM2.5 concentration is like.
When it comes to the radon and VOC sensors, I wasn’t able to do in-depth testing as I don’t currently own a radon sensor that I would consider good enough to use as a baseline and low-cost VOC sensors all report in relative values, meaning a comparison here would not be very useful. However, that is something worth discussing further so that people don’t get confused about how useful VOC sensors are.
So, what’s the common issue with low-cost VOC sensors? Well, they show relative readings, not absolute values. This is not unique to the Airthings View Plus’ BME680 VOC sensor either, but it is common across every low-cost VOC sensor, to my knowledge. The screen from the BME680 datasheet below highlights the issue.
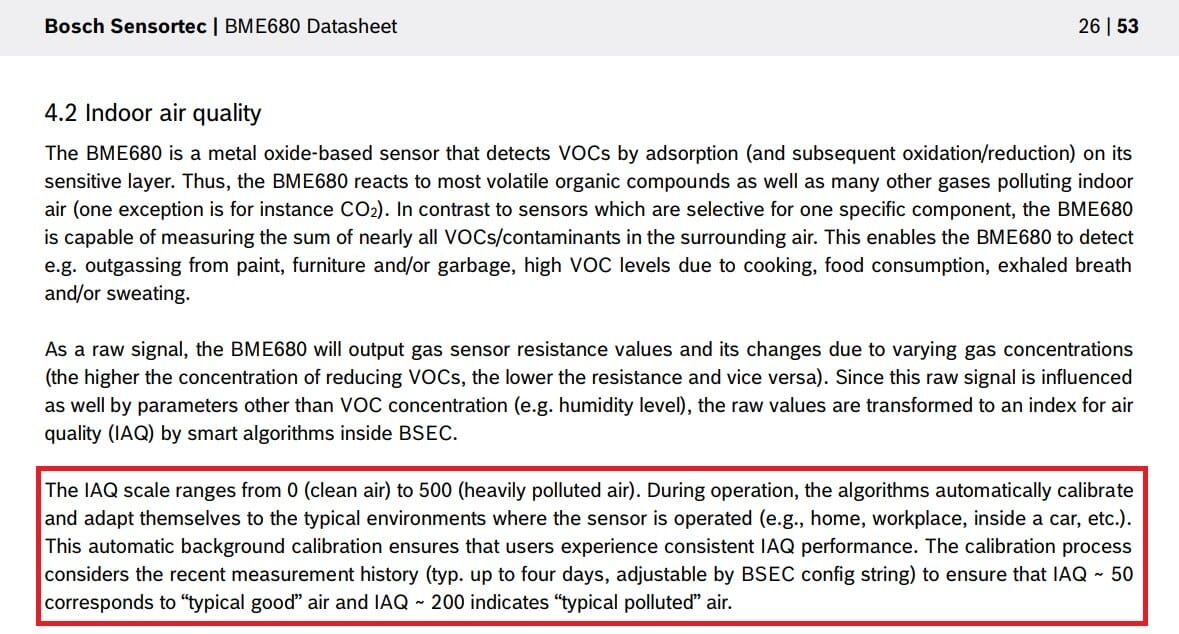
As you can see, the datasheet states that the sensor outputs a relative value based on data from the past four days (unless changed by the manufacturer – I’m unsure if Airthings has adjusted this, so let’s assume it also uses the four-day period). Confusingly, Airthings portrays VOCs as an absolute value in parts per billion (ppb) in the app. This is not true, and the shown value is a relative value based on the device’s recent exposure to VOCs.
Again, this isn’t an issue unique to the Airthings View Plus, and it’s only something I learned recently, meaning I need to update many previous reviews on this website. With that said, I’m not particularly fond of how the app portrays this value as absolute when it’s actually relative and will adjust as the device is exposed to more or less VOCs. Either way, the takeaway is that the device’s VOC sensor can detect increases and decreases in VOC levels, which has some usefulness. Still, it should not be trusted to provide absolute concentrations.
After spending far longer on this section than I intended to, let’s wrap it up! Overall, the Airthings View Plus is an accurate monitor. The monitor is accurate regarding particulate matter and carbon dioxide, with the caveat that it tends to read too high for the latter and fluctuates quite a lot for the former. I trust the readings from this monitor, and I would be happy to use it in my own home and act on the data it provides. When it comes to radon, it reads similarly to my other monitors, which I trust, but I wasn’t able to test that for this article. Finally, regarding VOCs, the device is useful but has the same issue as other low-cost air quality monitors – the readings are relative, not absolute.
Design
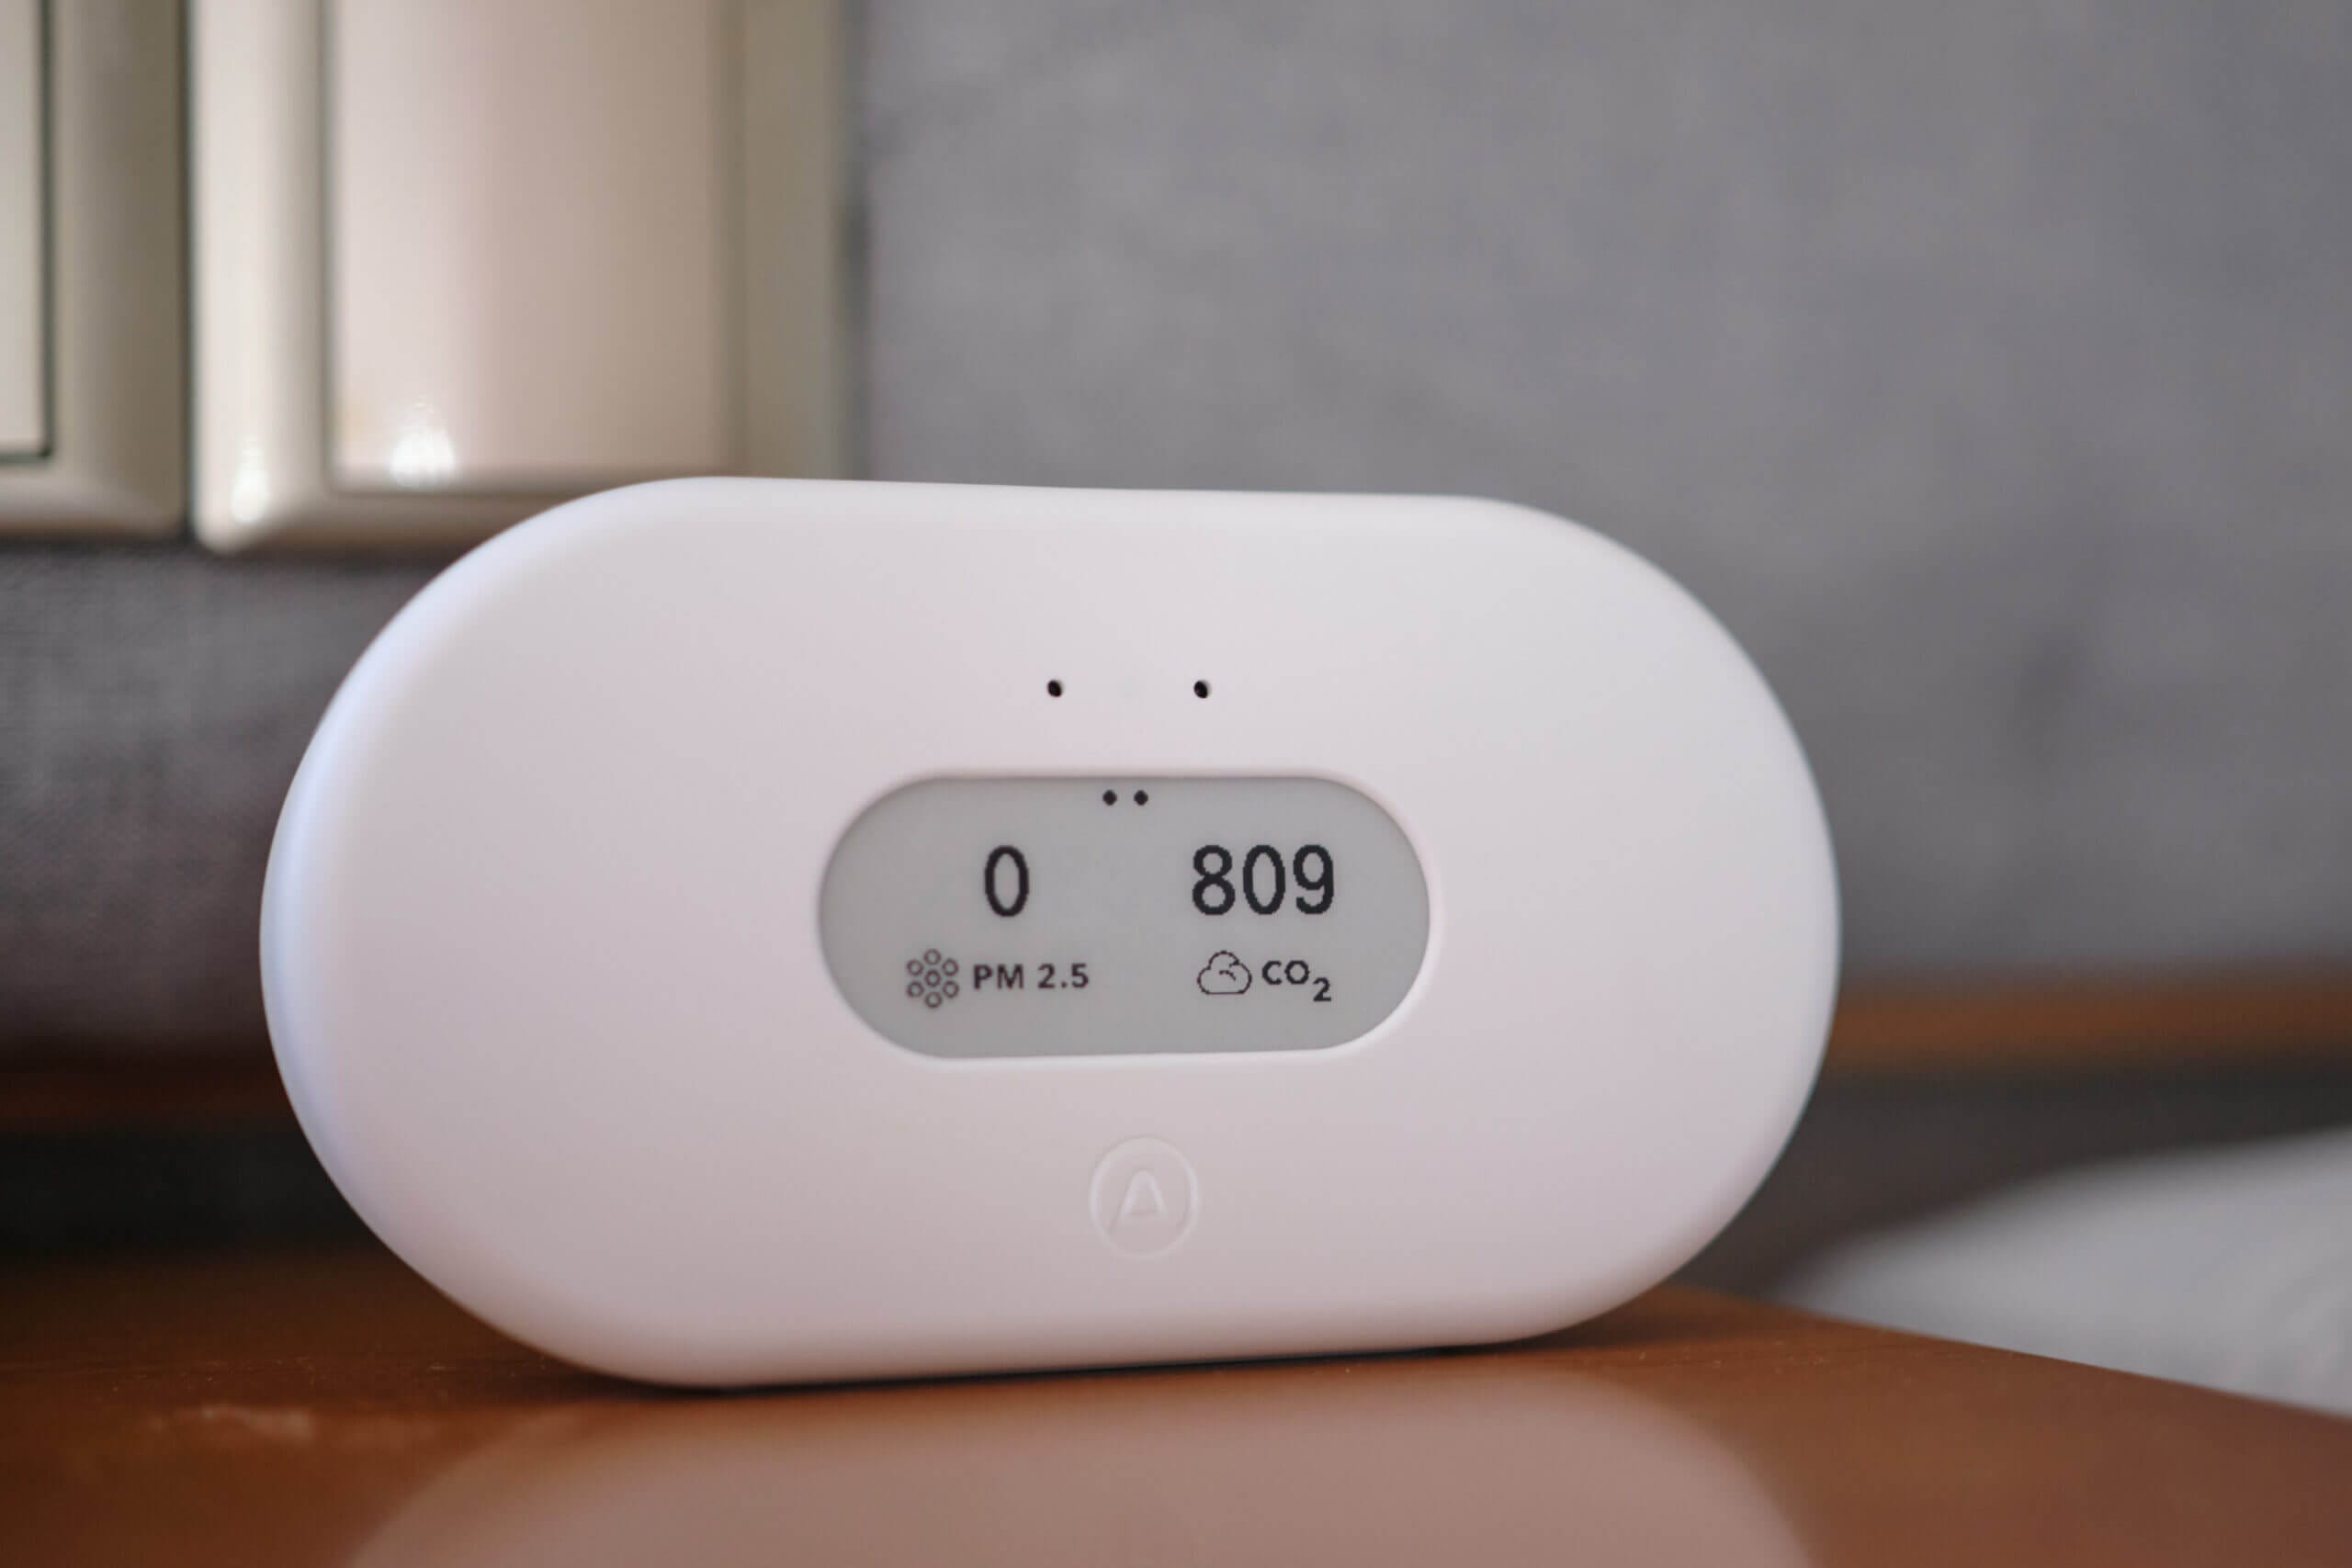
The Airthings View Plus is a simple-looking air quality monitor designed to fit nicely into any environment – from a minimalist room to a busy shelf. While most air quality monitors these days embrace this simple, white style, I continue to appreciate it because it means the monitor blends into any environment. Coupled with the E-ink screen, this device is far from distracting.
Despite having a small E-ink Screen, the View Plus is surprisingly large. This is because the device has to house six AA batteries, which allows it to remain functional even if it isn’t plugged in. This also means it is a relatively heavy device (at least when it has all six batteries inside). While the weight is far from an issue, it, combined with the size, leads me to conclude that this isn’t so much a portable monitor as it is a monitor you can put anywhere in your home and office without worrying about powering it.
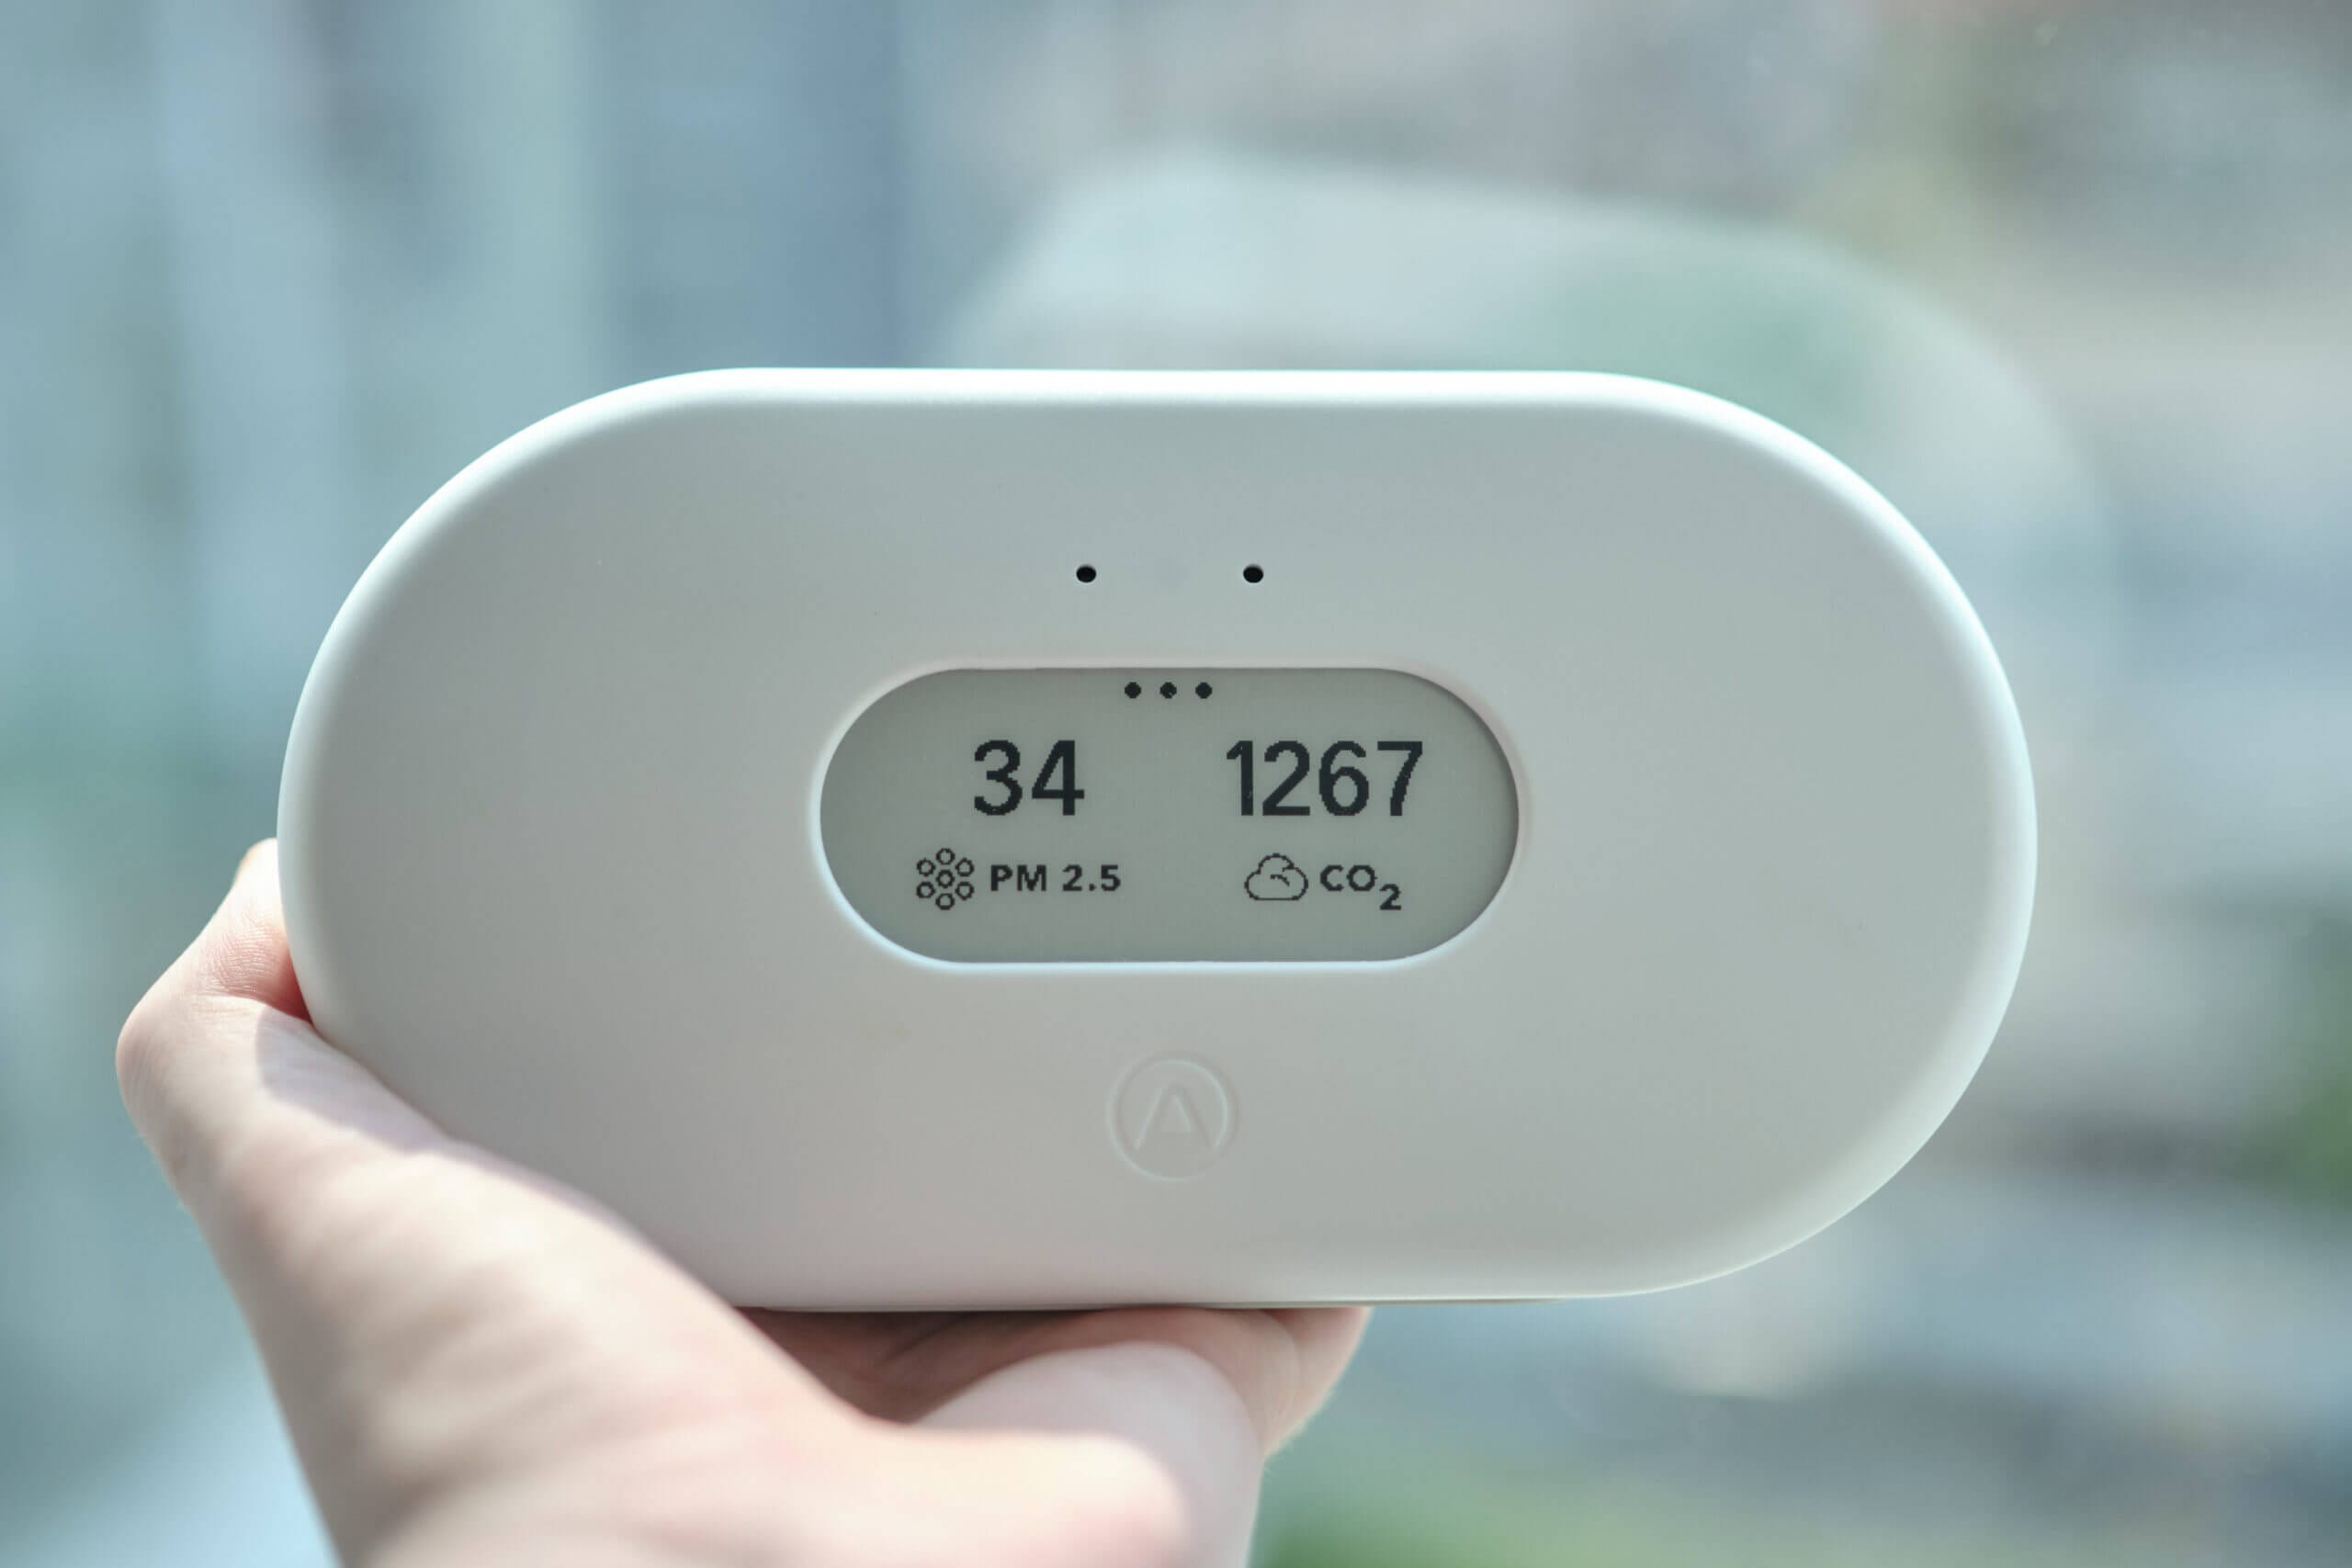
Sure, the View Plus is technically ‘portable’, but its size means you won’t want to carry it around with you.
Therefore, this device is portable in the sense that it’s perfect if you’re looking for a monitor that you can quickly and easily move between rooms in your home or office. Not needing to worry about plugging the device in is very refreshing! That said, if you want a portable monitor—one that you can take everywhere with you—you’re better off with a dedicated portable monitor such as the Atmotube Pro. The Atmotube is far better suited to being carried on a backpack for outdoor readings.
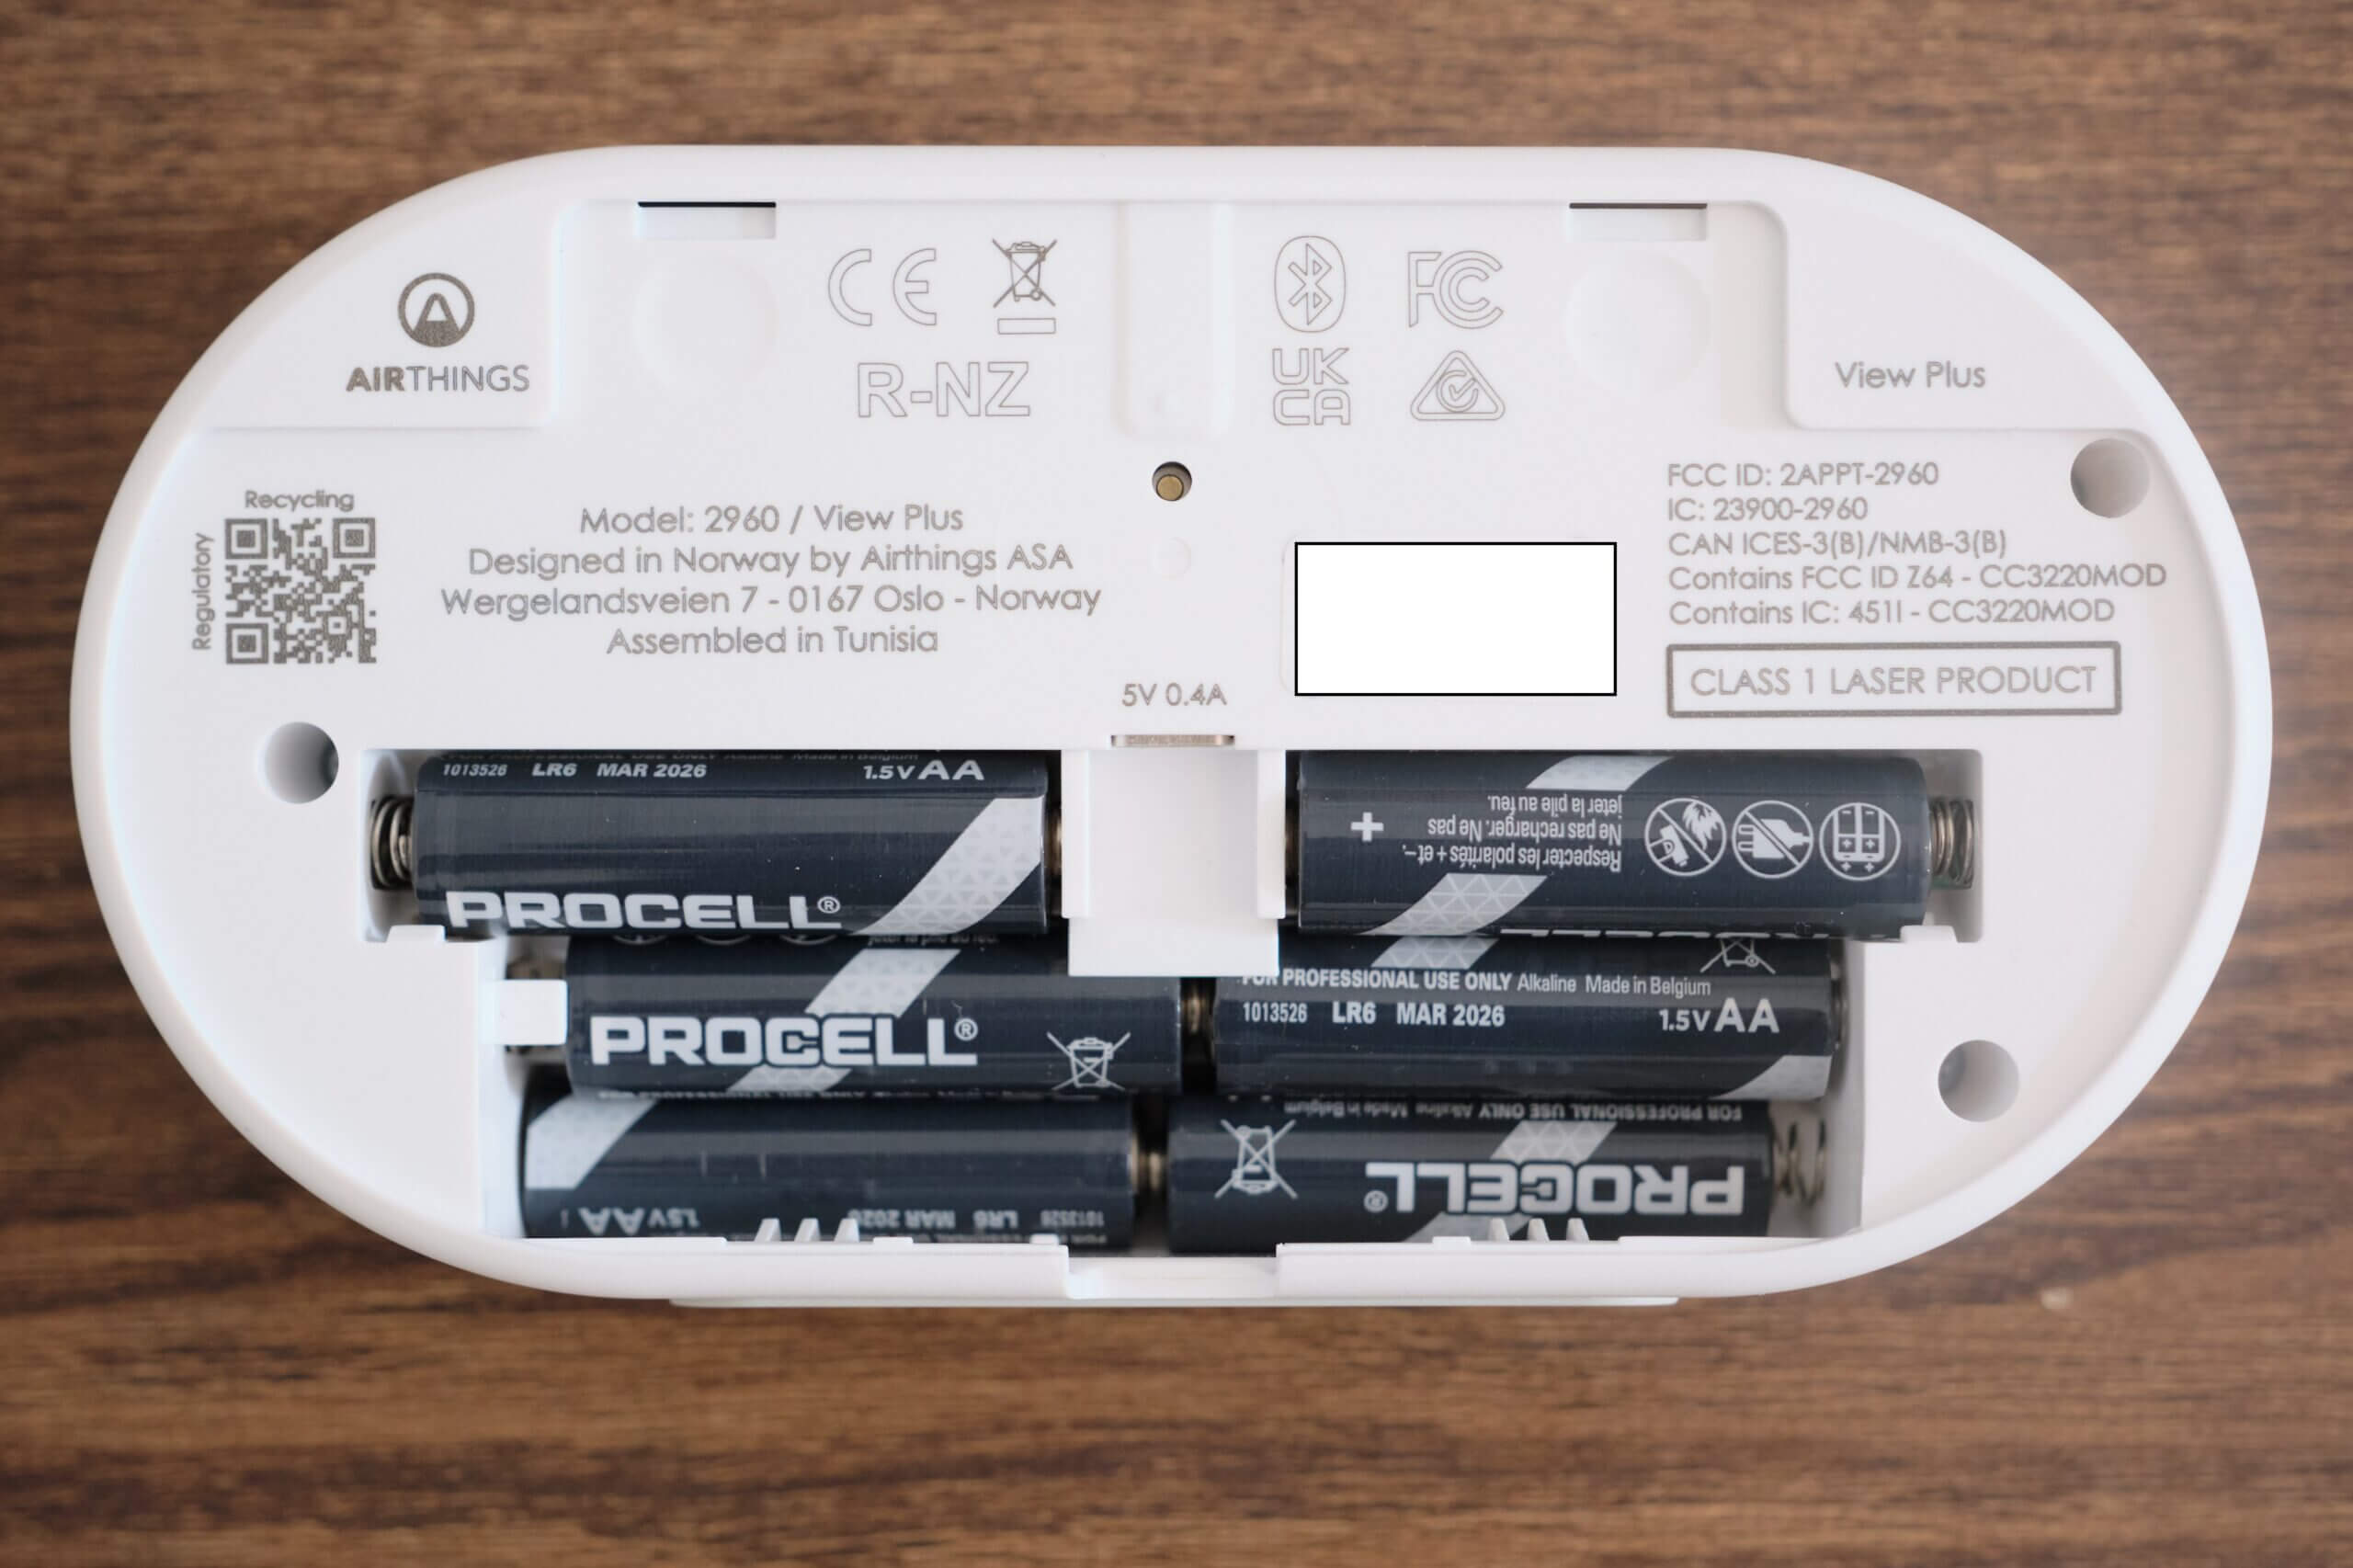
If you don’t need portability, you can plug the Airthings View Plus in via a USB Type-C cable. Interestingly, this cable is inserted by removing the back cover and running the cable through a gap. While this isn’t inconvenient, it isn’t exactly a device you can unplug and quickly move to another room – at least, not when it’s powered via cable. Of course, if you want the device to be portable, you can use the AA batteries instead.
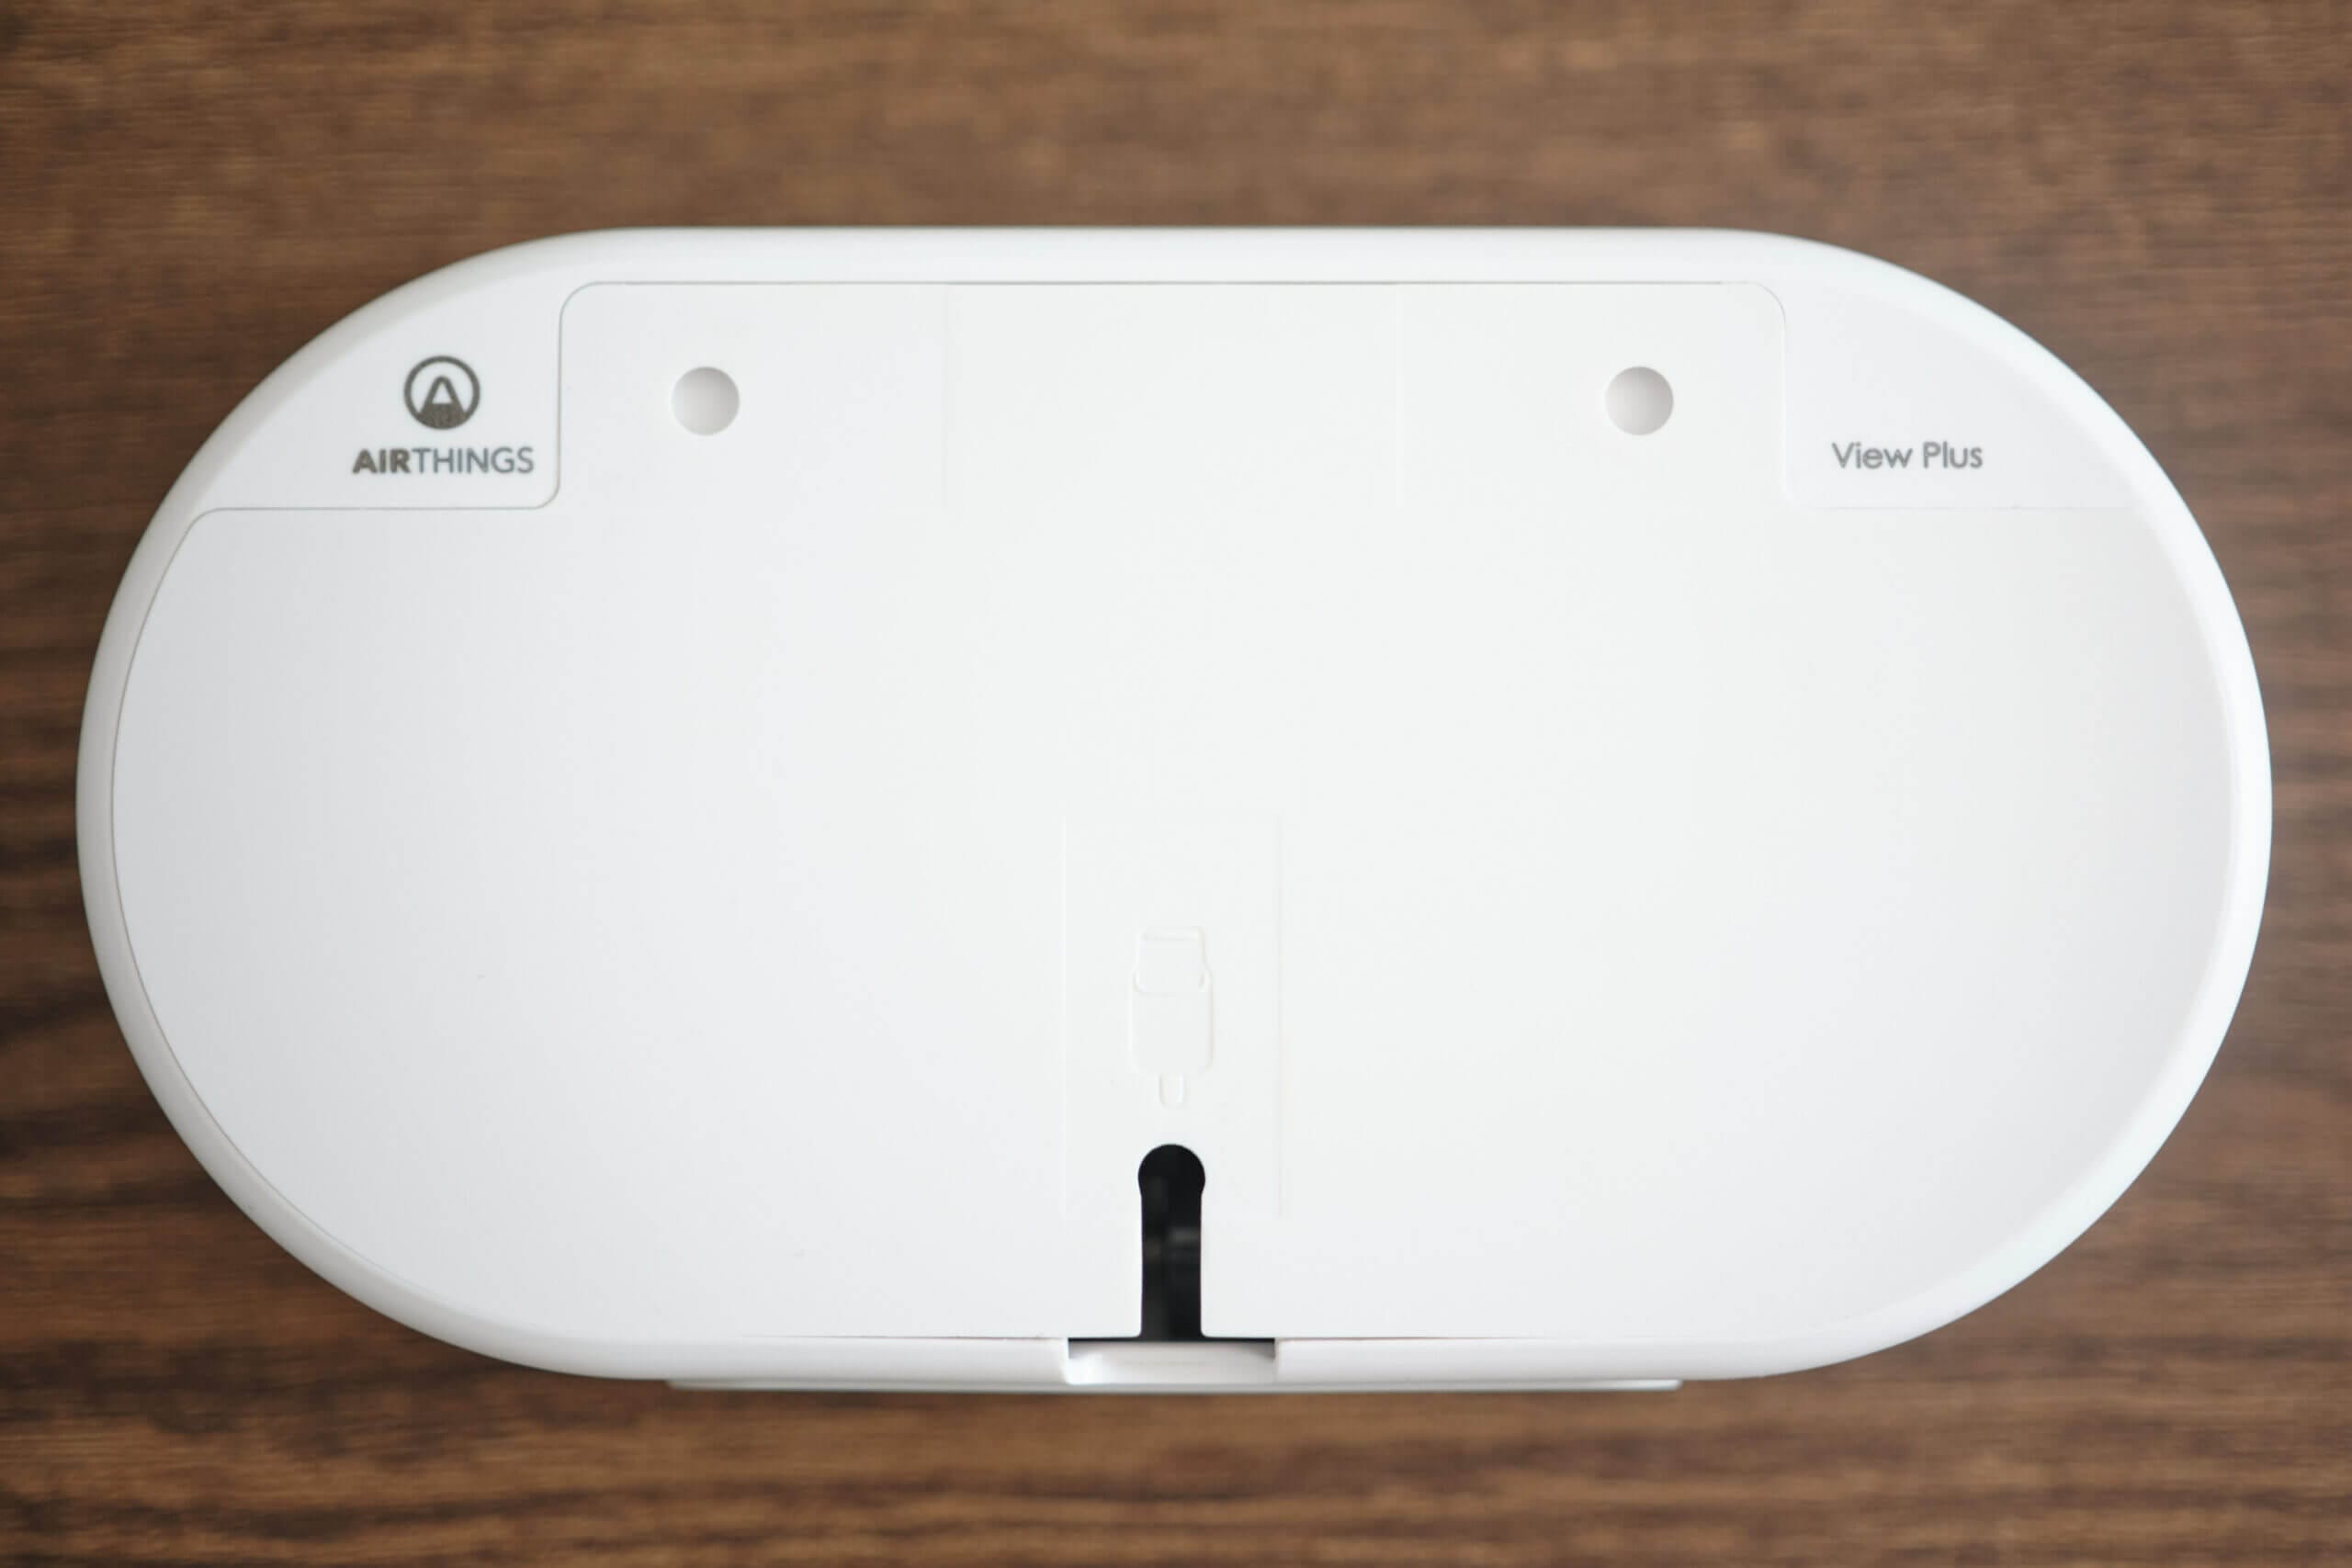
The Type-C cable runs under the gap in the bottom of the device, behind the removable backplate.
I appreciate this approach even for my fixed monitors, as cables are often frustrating. Not only do they usually require an extra power socket, which I usually can’t spare, but hiding cables can sometimes be quite challenging. Using batteries instead means that I don’t need to worry about these issues, and I can take the monitor anywhere I want, whenever I want.
Relying on batteries has a few limitations, which I will discuss further in the connectivity section. Overall, and in terms of design, I am a big fan of this choice, but it isn’t without a few disadvantages.
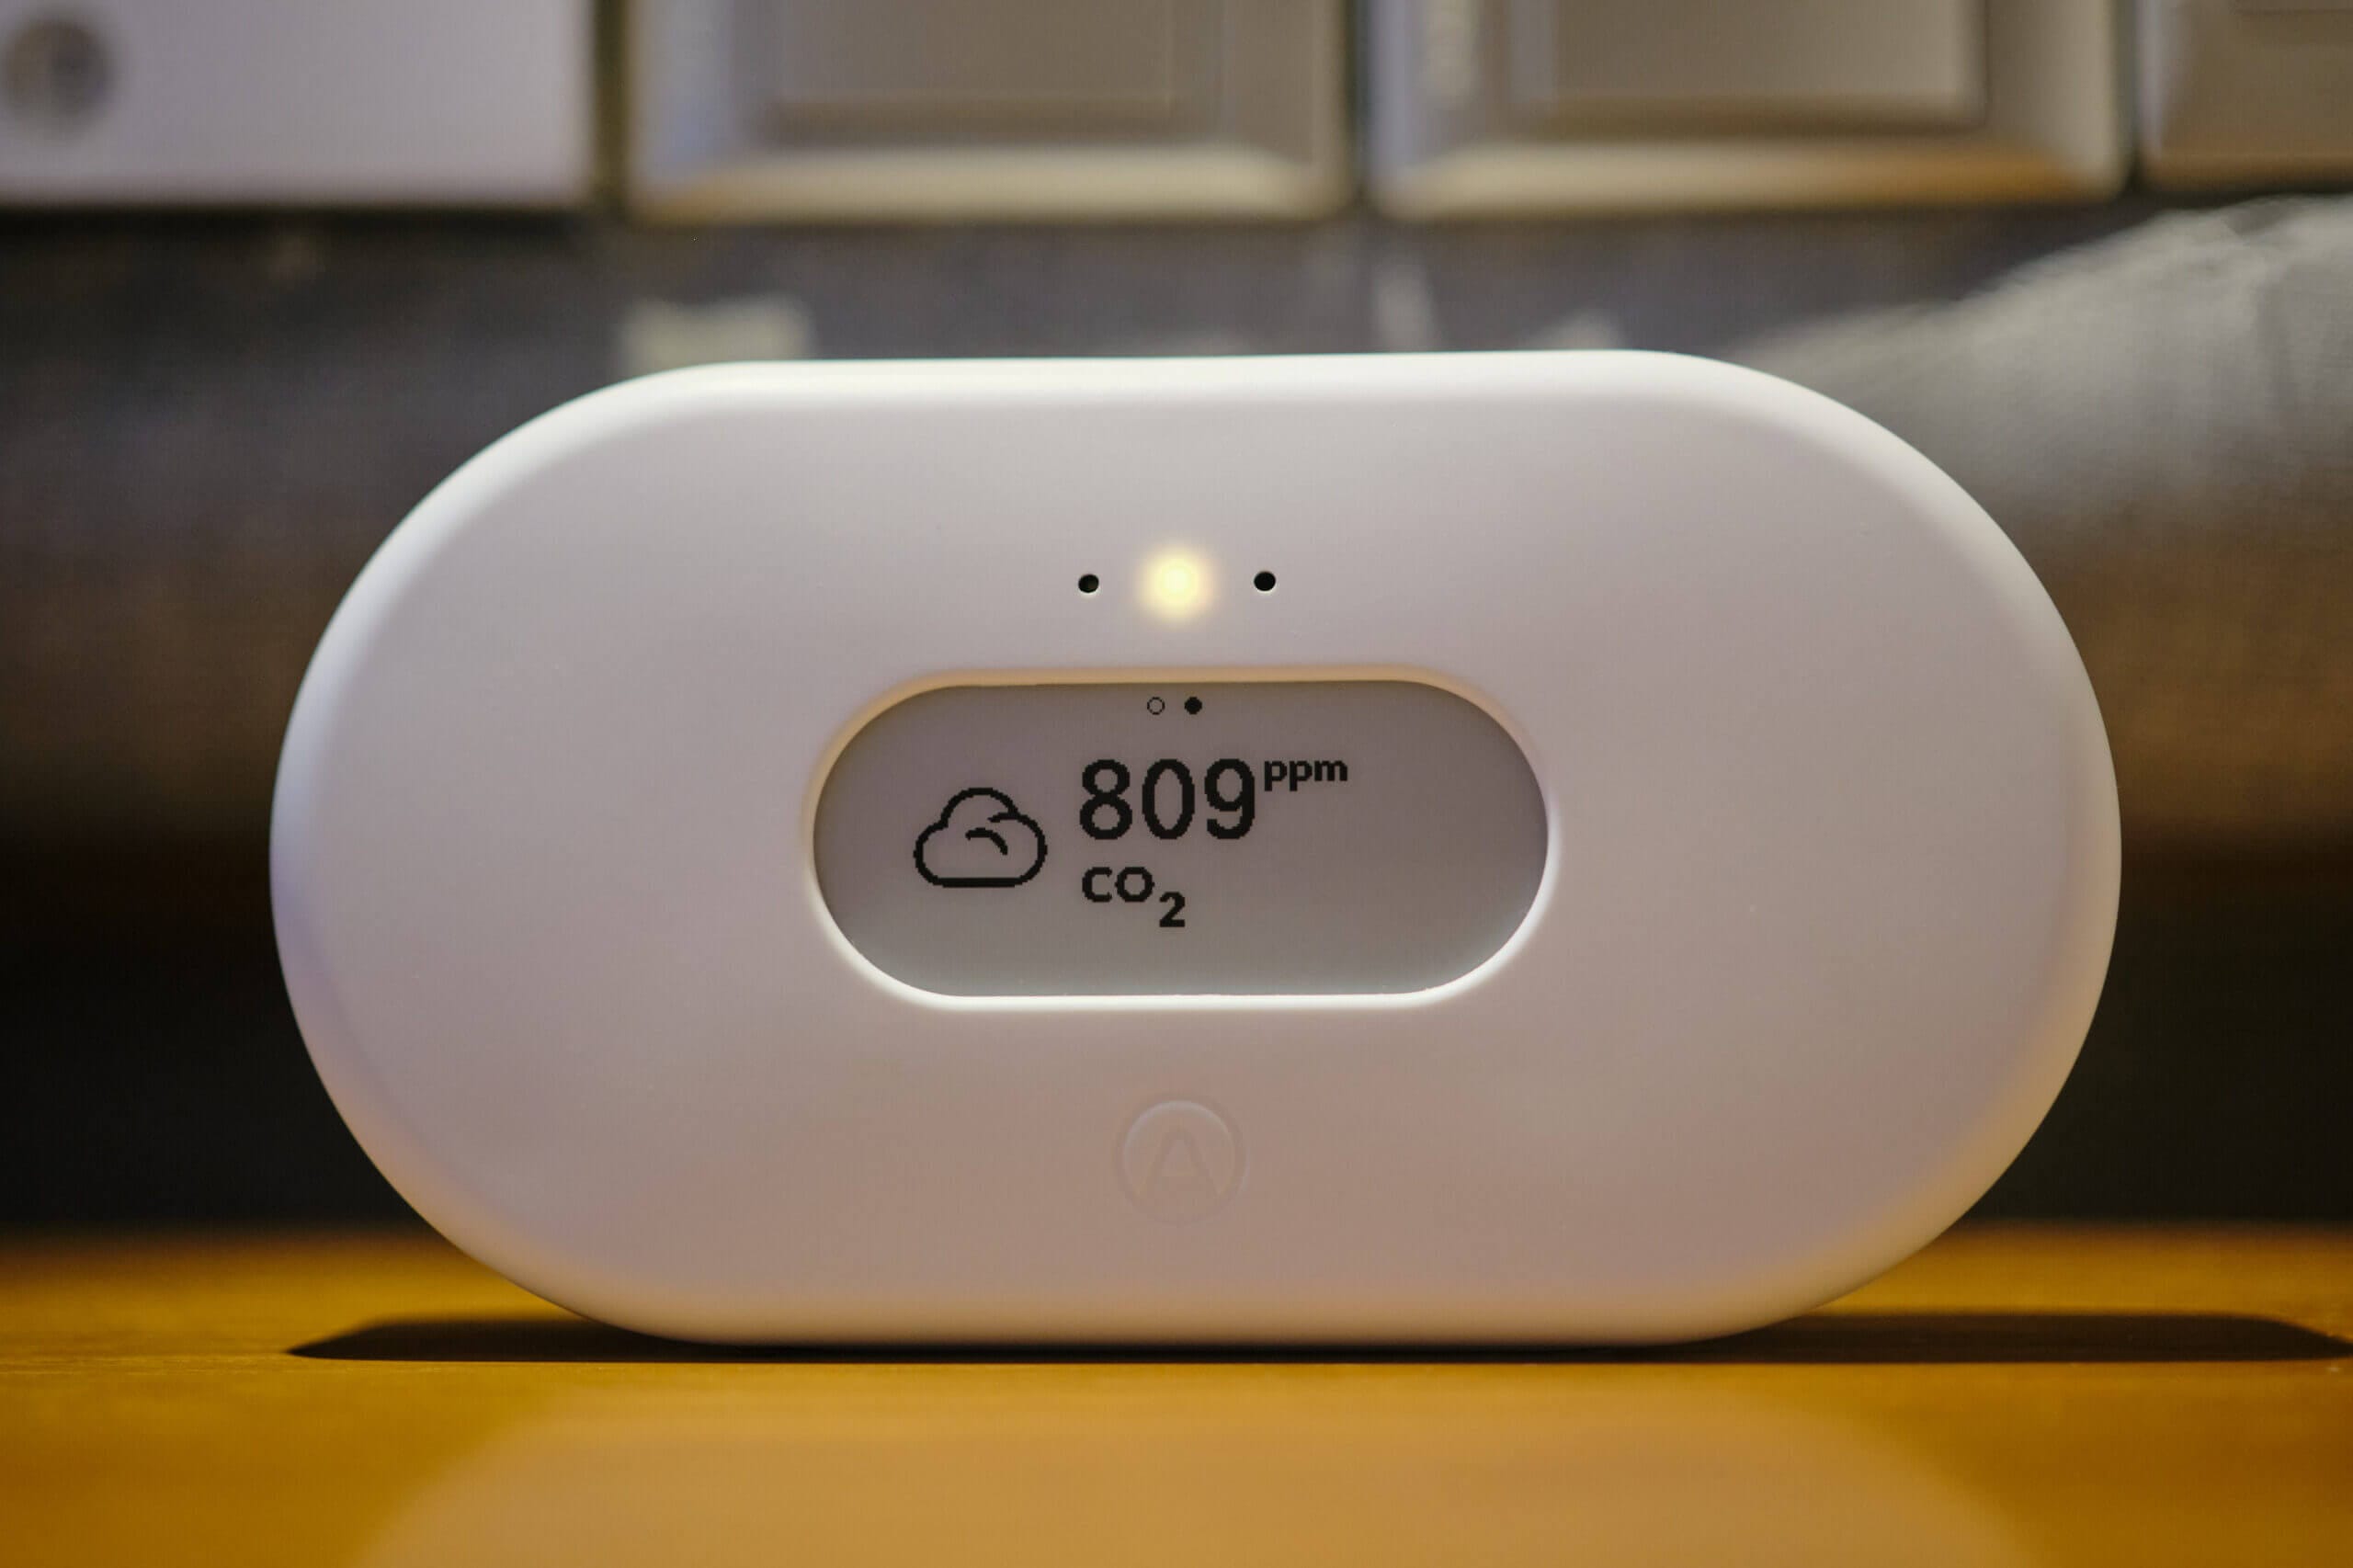
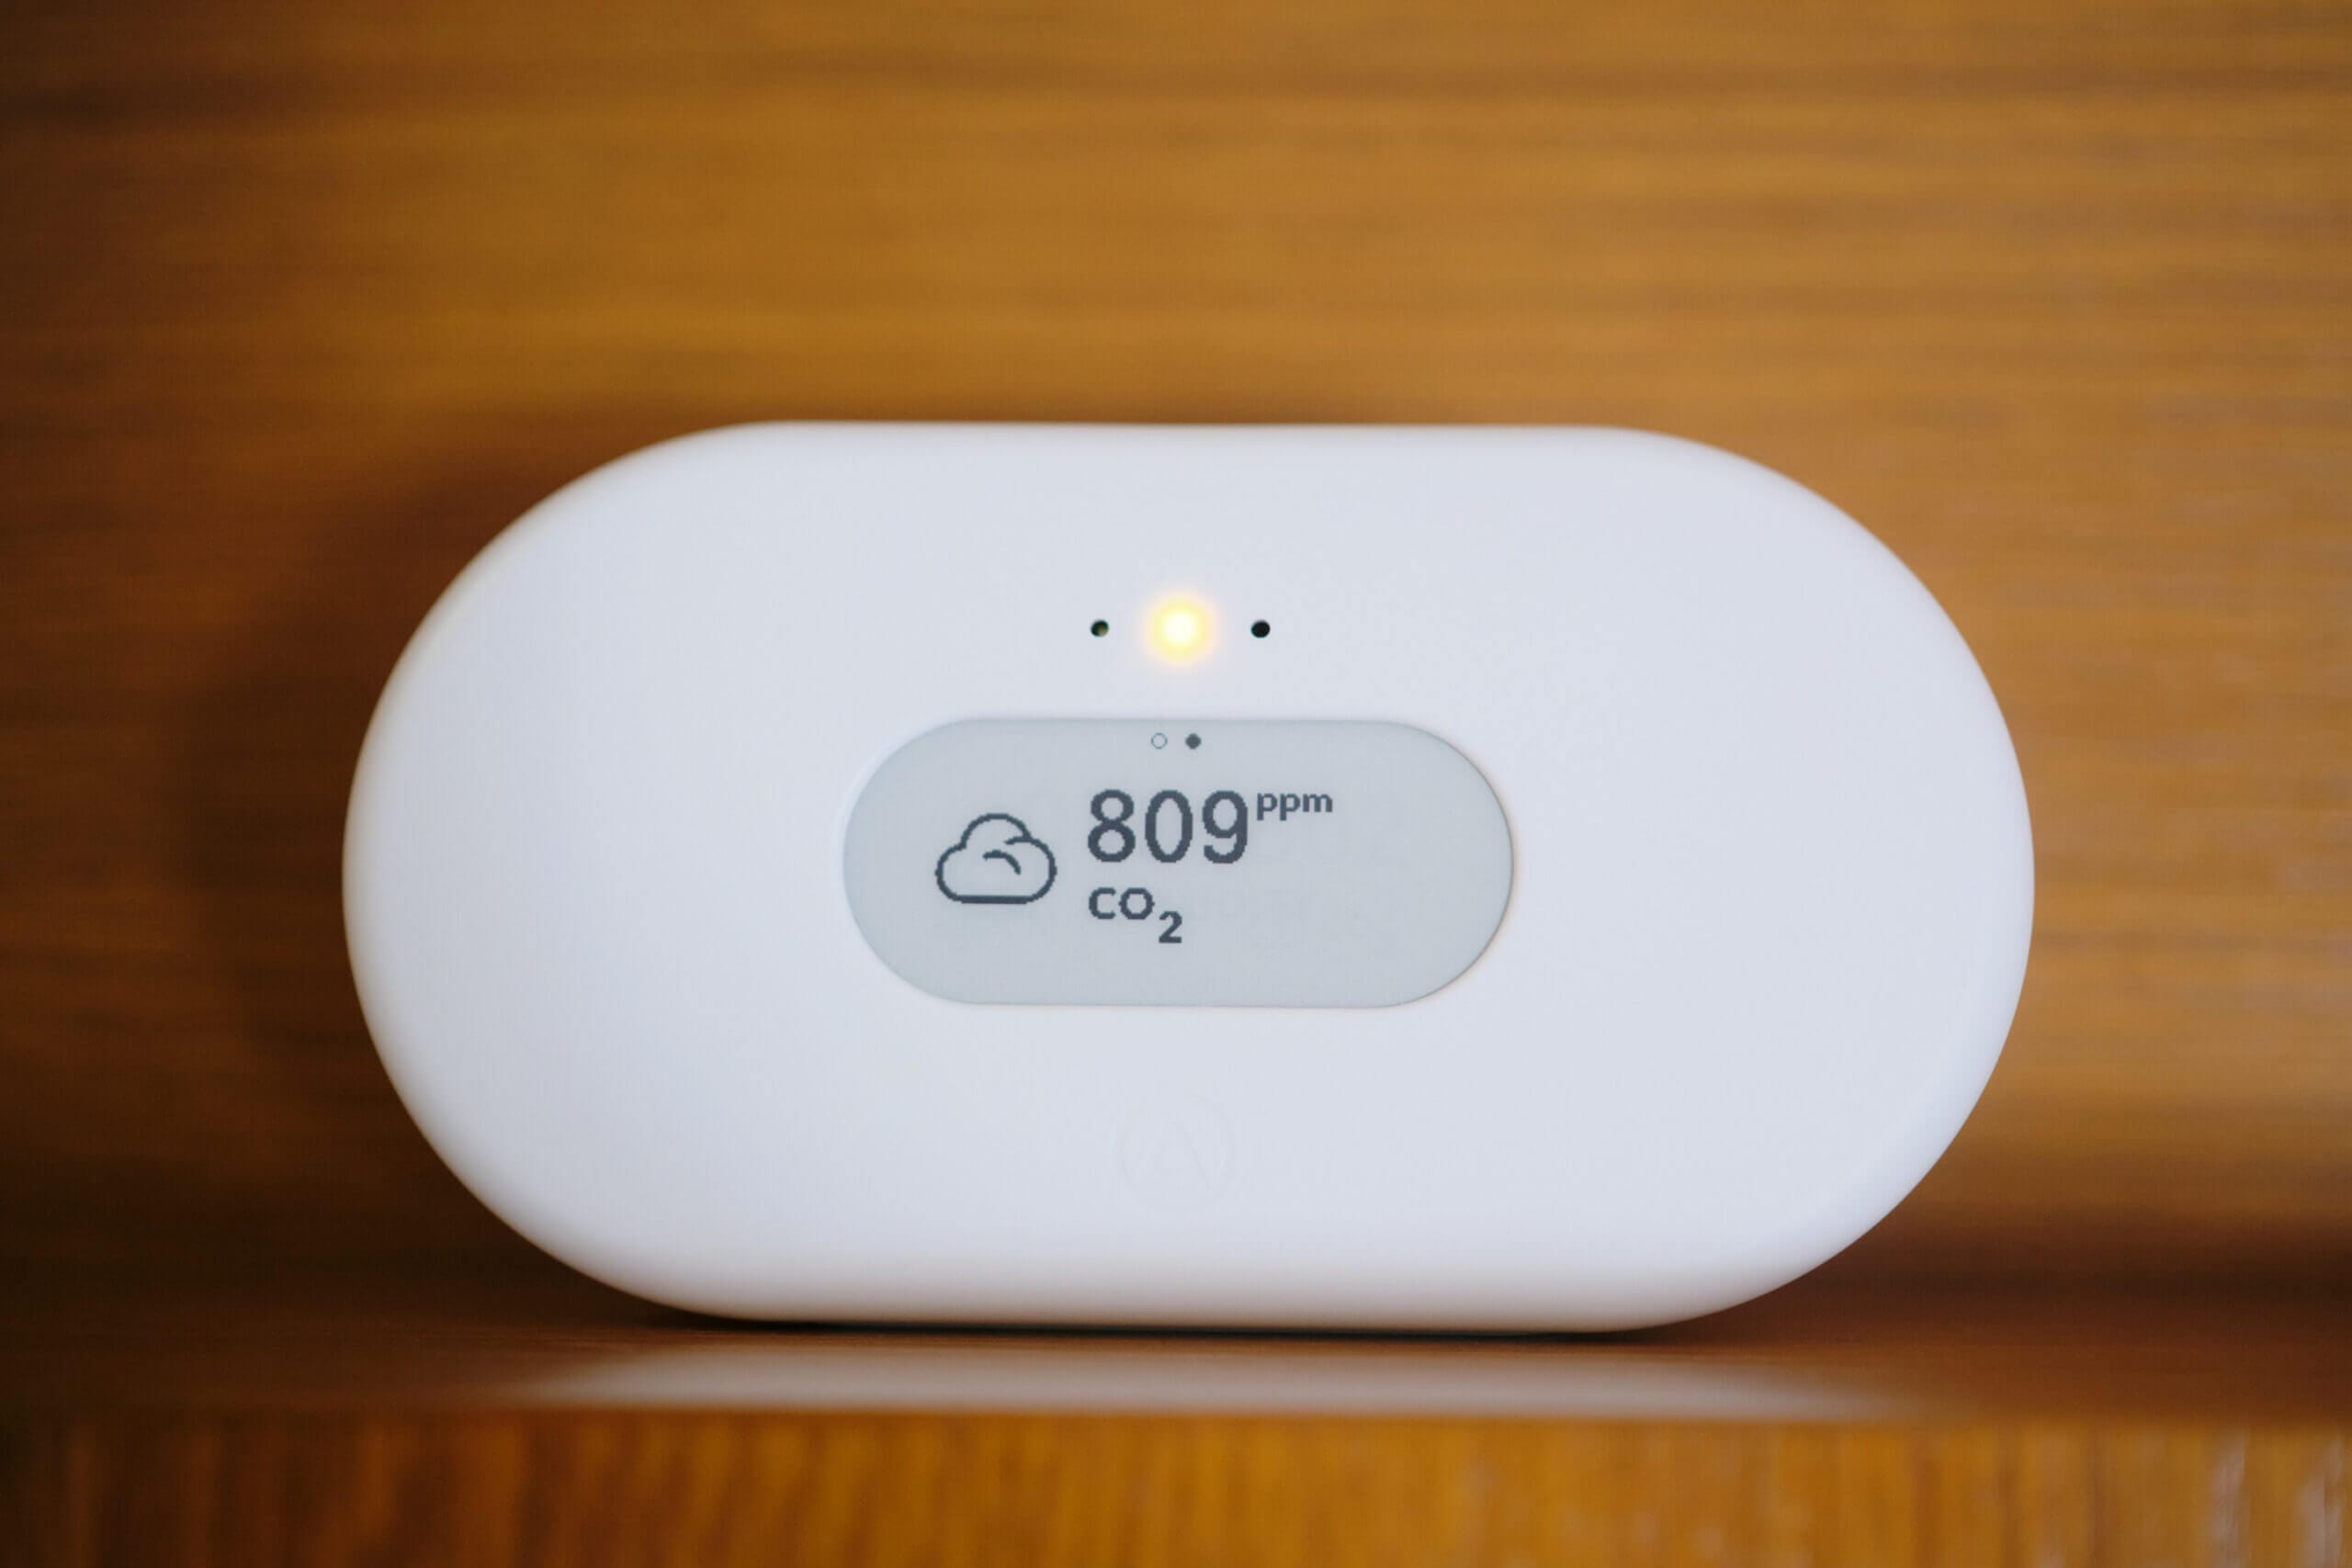
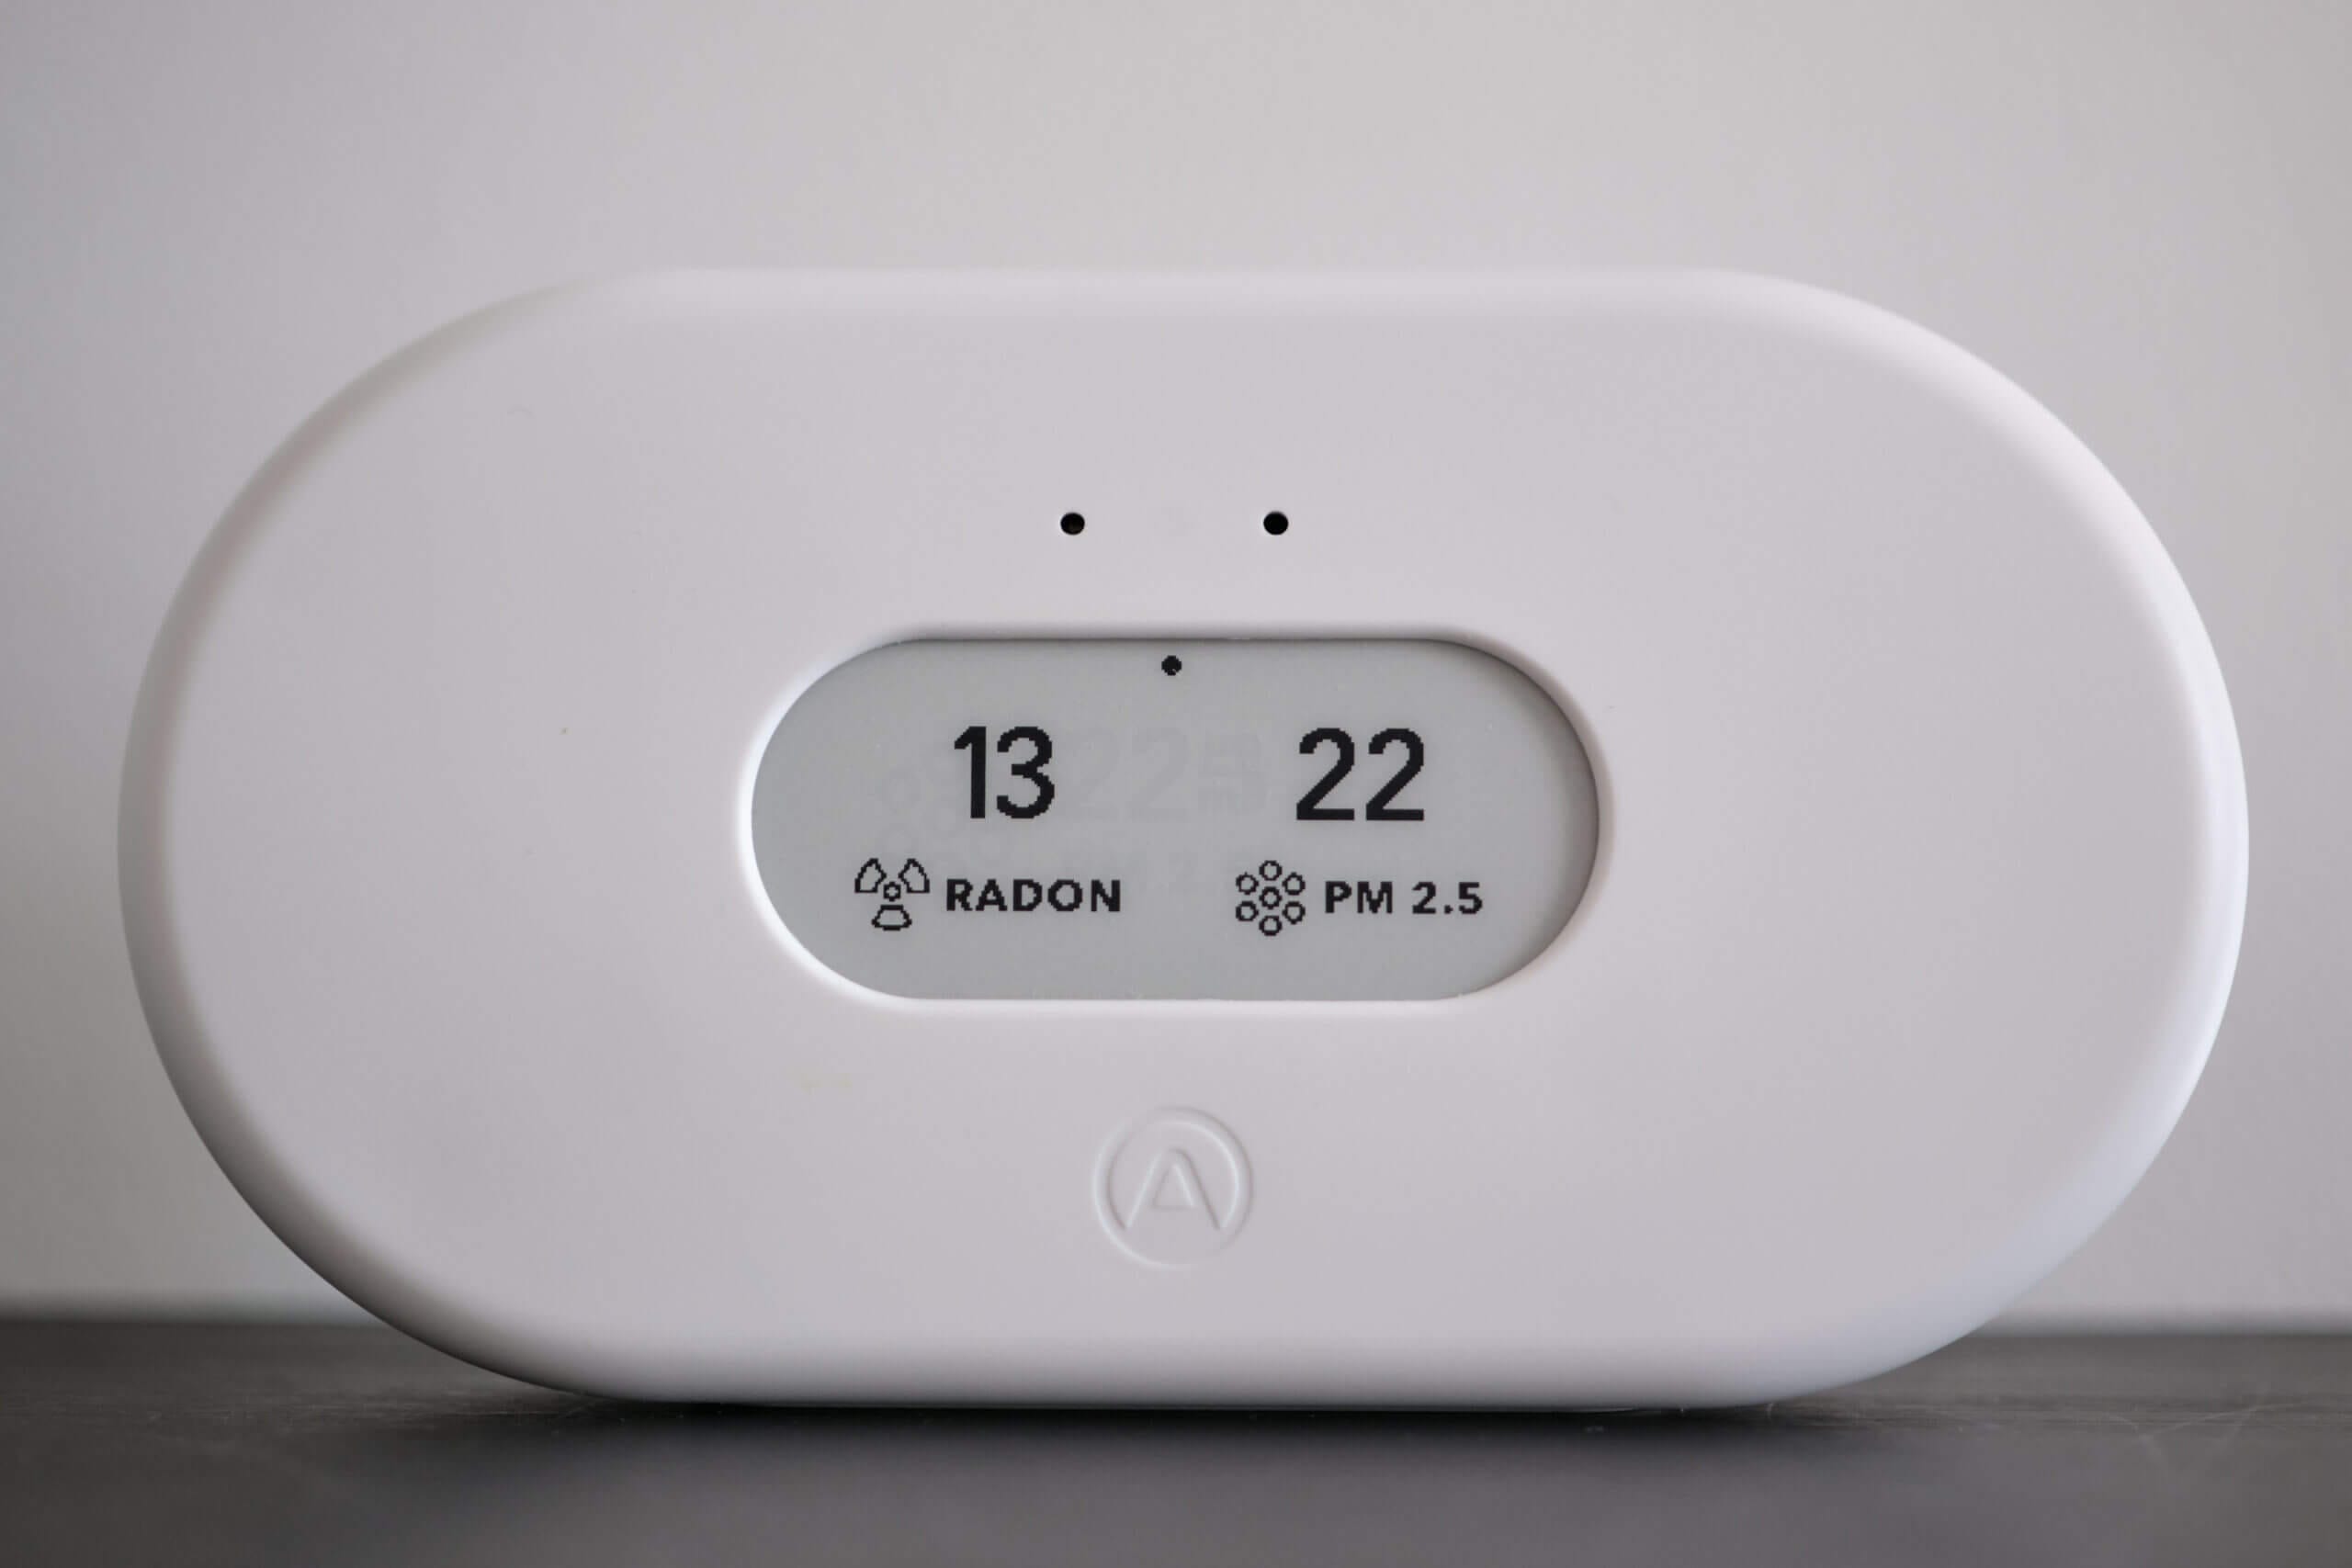
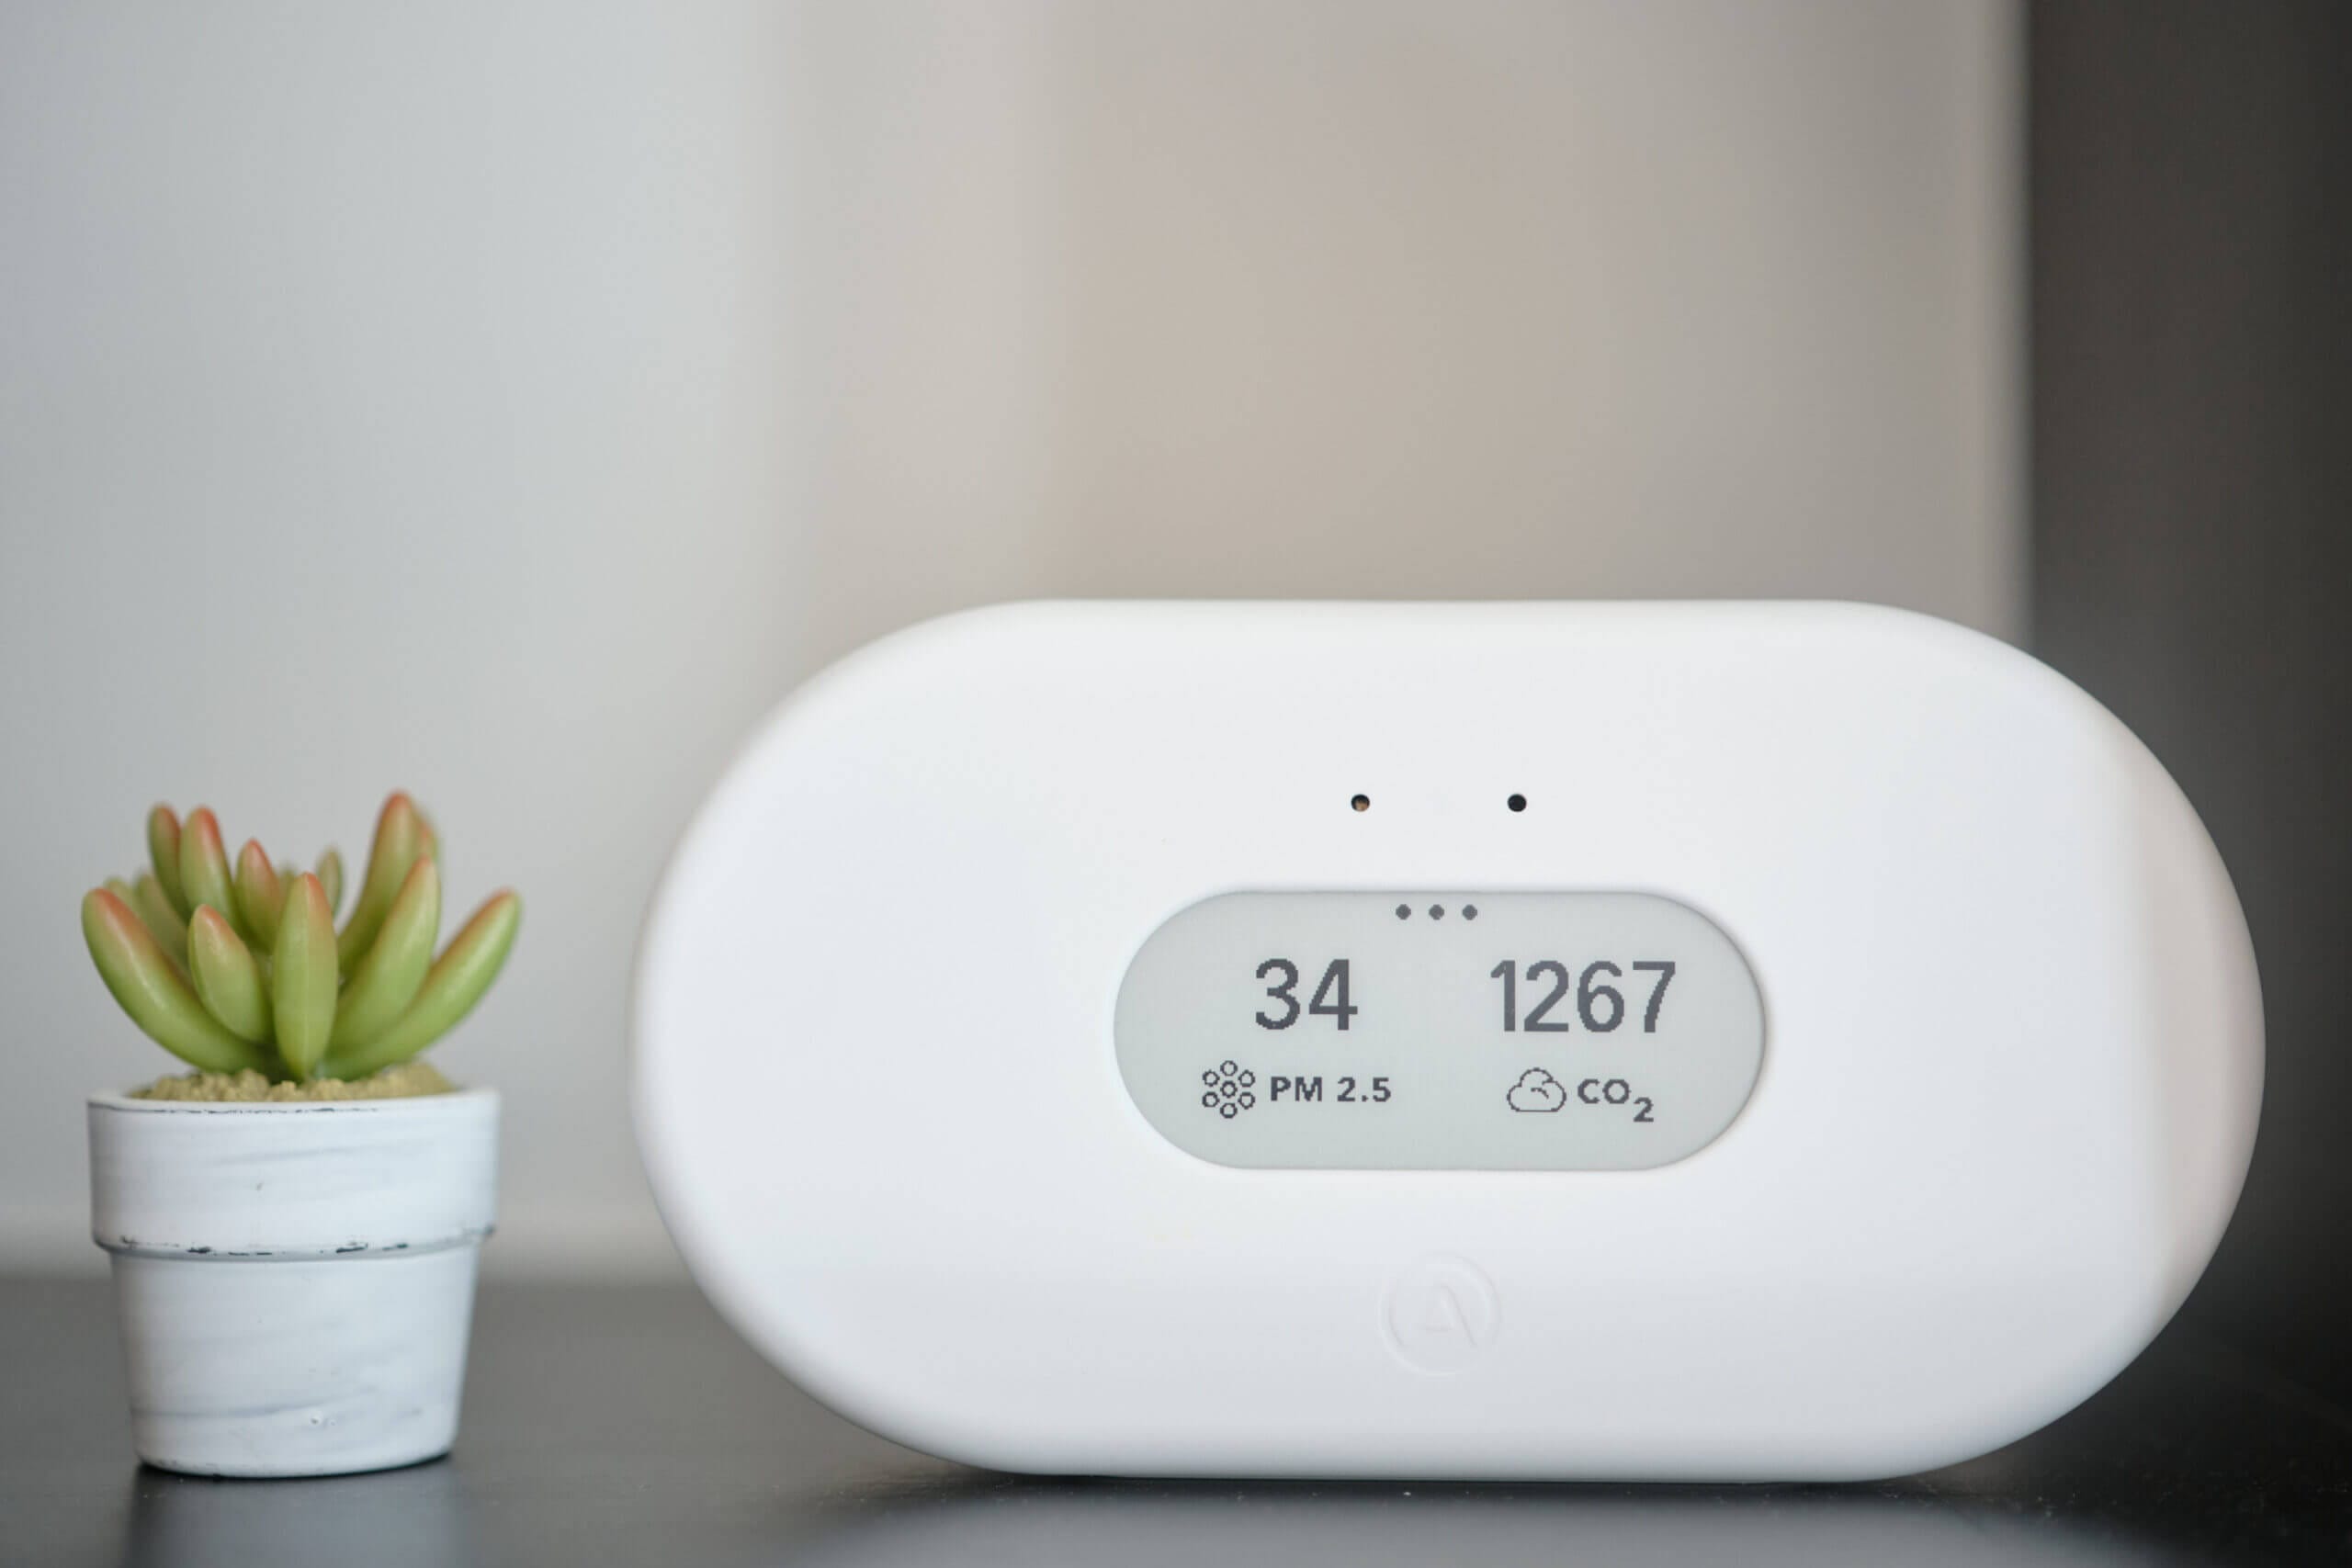
Now, let’s turn our attention towards the front of the device. Here, you will find the surprisingly small E-ink screen showing the concentration of two pollutants of your choice. While I saw some other reviews criticise the small screen size, it doesn’t bother me much as I tend to refer to the app usually instead. For this reason, I tend to opt for monitors without screens (or with very small screens), such as the AirGradient ONE and uHoo Air Quality Monitor, in my own home.
Being E-ink, the screen has fantastic contrast and is viewable across a room. However, this also means that the screen can’t be seen in the dark, as there is no backlight. Again, I personally don’t mind this, as many of my favourite monitors have E-ink screens, but it might be an issue for you.
As mentioned, since the screen is so small, the device only shows two pollutants simultaneously. While you can choose which pollutants are shown, you can only see two on the device’s ‘home screen’. The app will let you choose any two pollutants from radon, PM2.5, VOCs, CO2, or environmental factors such as humidity, temperature, pressure, or outdoor temperature (retrieved from the internet).
So, how do you see the concentrations of other pollutants you haven’t chosen to see on this screen? Well, you can wave your hand in front of the device, and it will start to alternate displays. If you’re wondering if this will trigger from people walking past, don’t worry! You must wave your hand very close to the device – within 15cm or so.
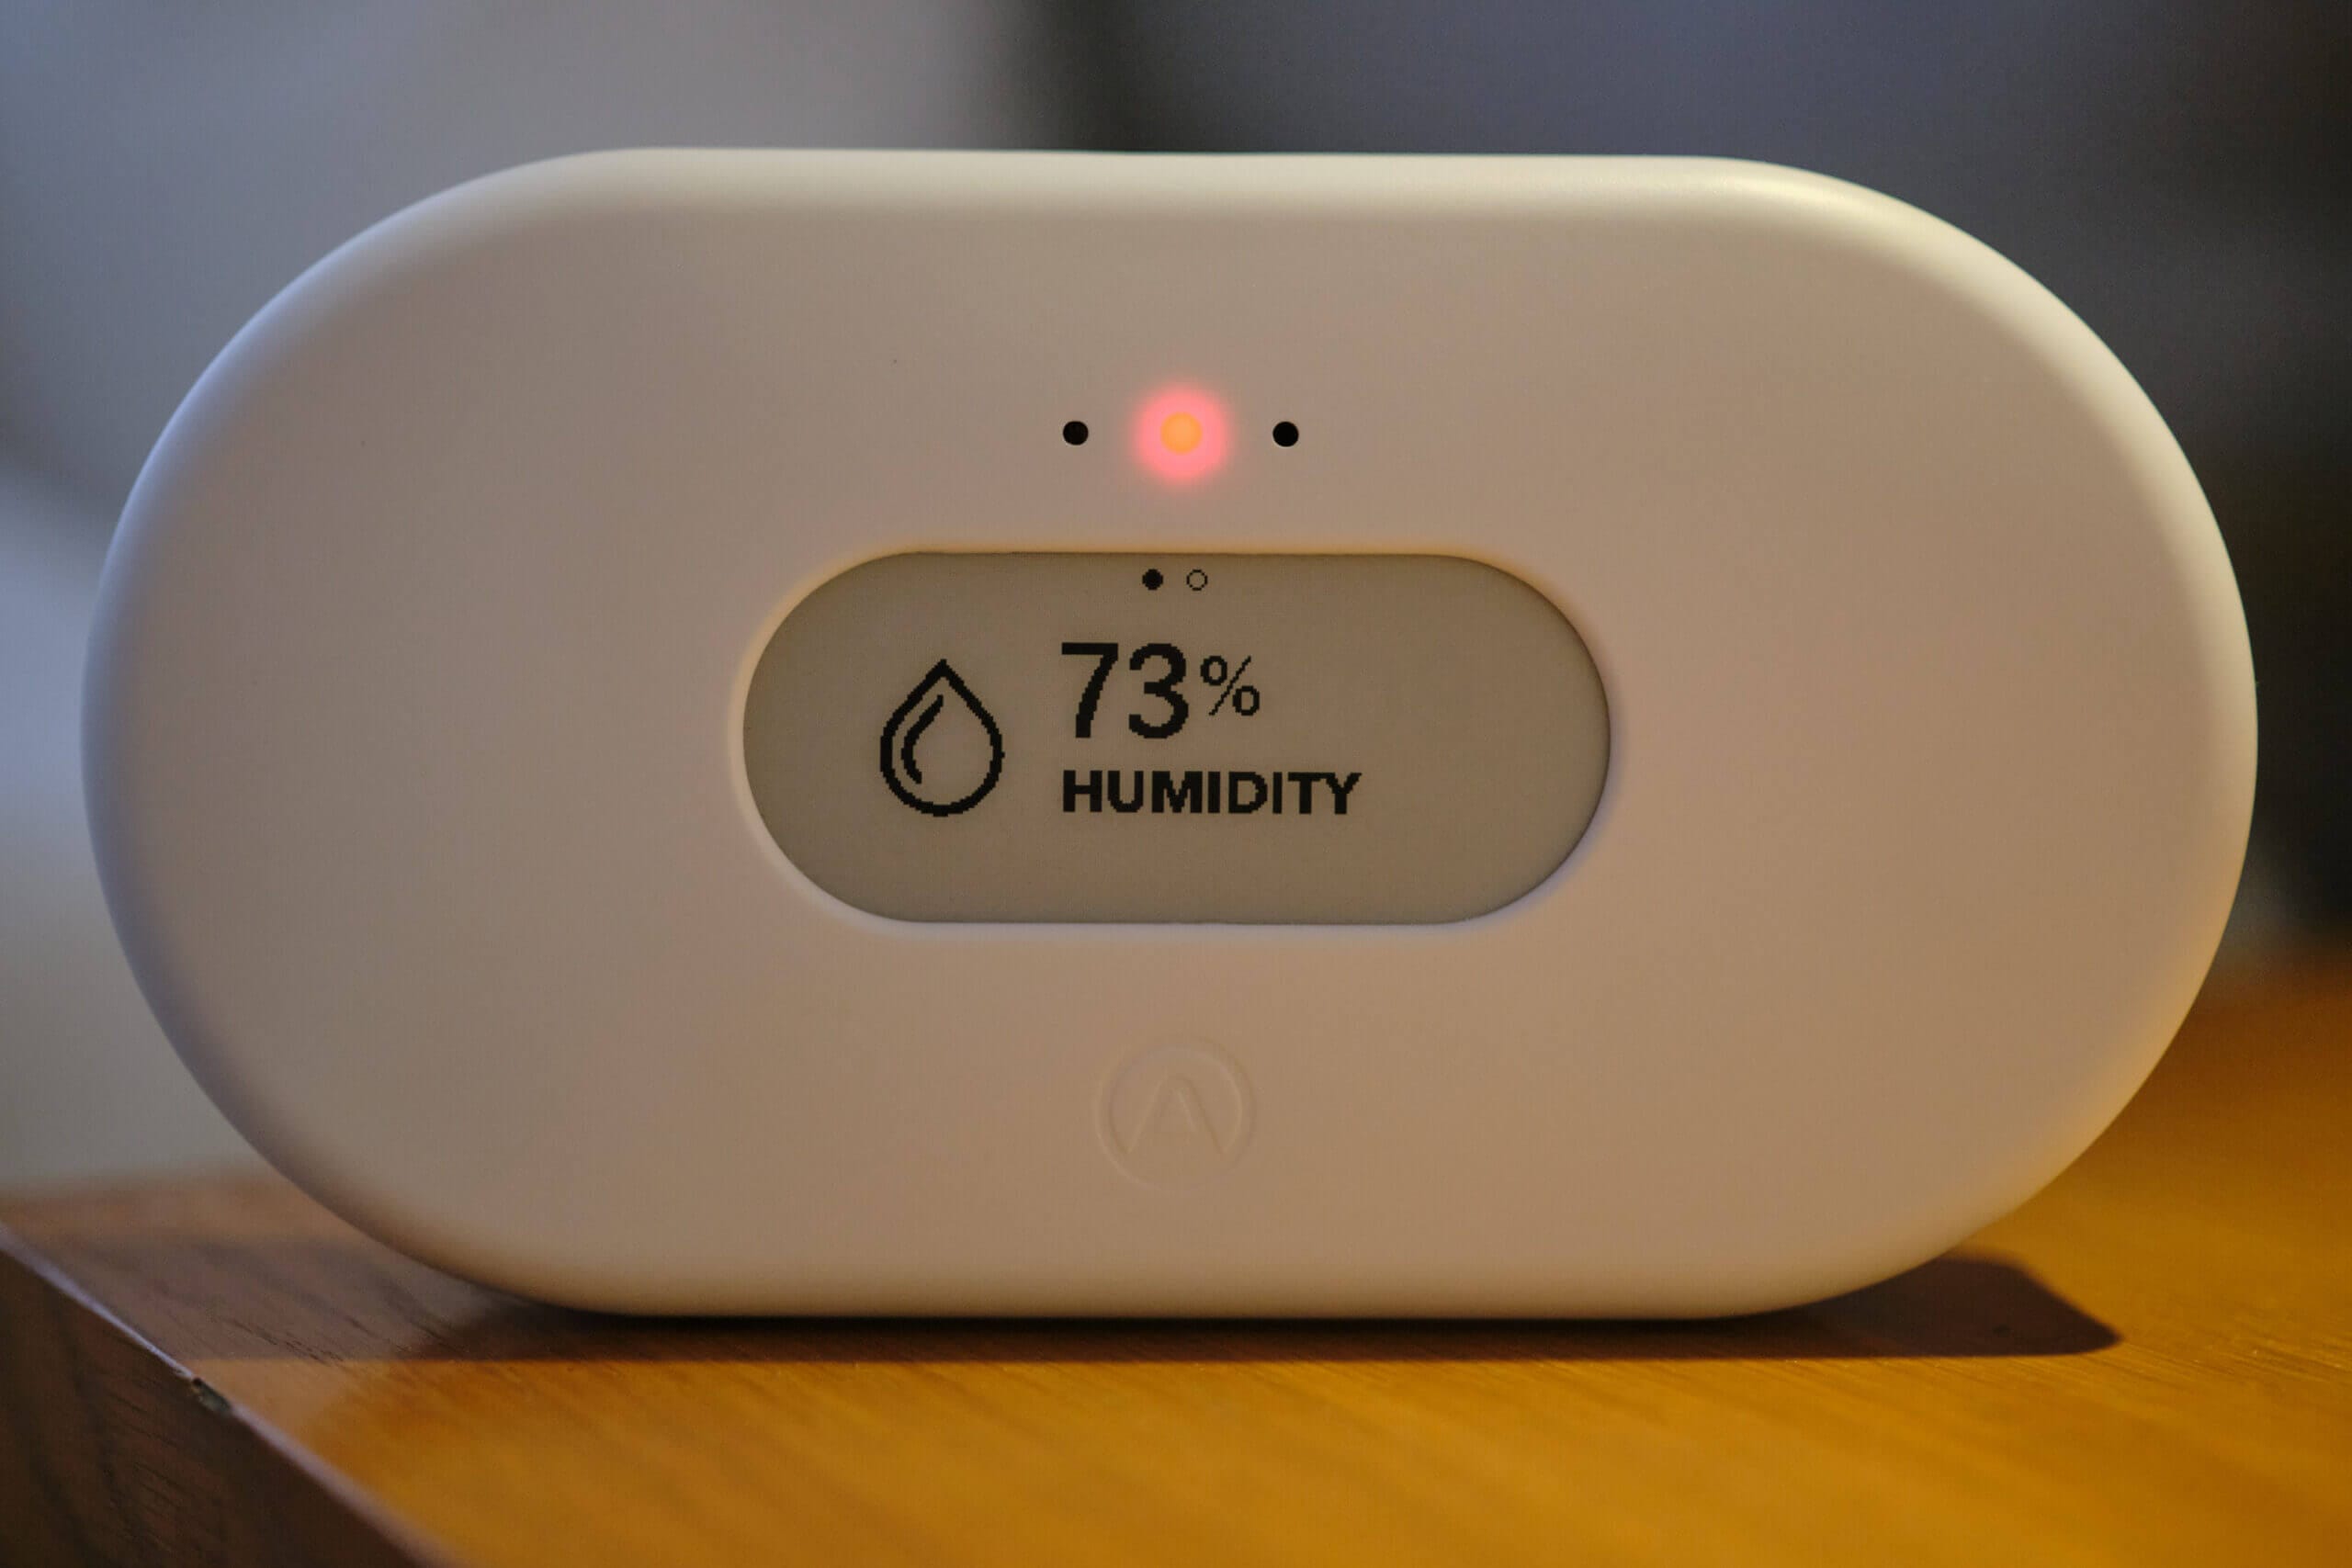
Once you’ve waved, the monitor will show you the first alternative screen (PM2.5), followed by further information. Accompanying the displays, you will also see the LED, which sits above the screen, light up based on the air quality values. I’ve seen this LED turn green, yellow, and red, and I don’t believe it has any other colours.
If you’re using the device in the dark, you will rely upon this LED as the screen isn’t backlit. Unfortunately, this leads to one of my issues with the device – you can’t adjust the thresholds for each LED. This is an issue, especially considering only three LED colours are shown based on air quality.
This isn’t a deal-breaker, but I believe all monitors should have adjustable thresholds, as many people have different risk tolerances for different pollutants. If I want to set higher or lower thresholds, I should be able to. At the very least, I would like to see more LED colours added, like an AQI scale (green, yellow, orange, red, maroon, purple). This would give me further details and allow me to easily differentiate between a CO2 concentration of 1400 ppm (red) and 4000 ppm (also red).
On the one hand, I like the simplicity of this design, and I mostly check the data via the app. However, it is also somewhat frustrating to wait for the device to cycle through pollutants/environmental factors until it gets to the information I want. While I can choose what to show on the home screen, there is no way to change the order of the screens displayed when you wave at the device.
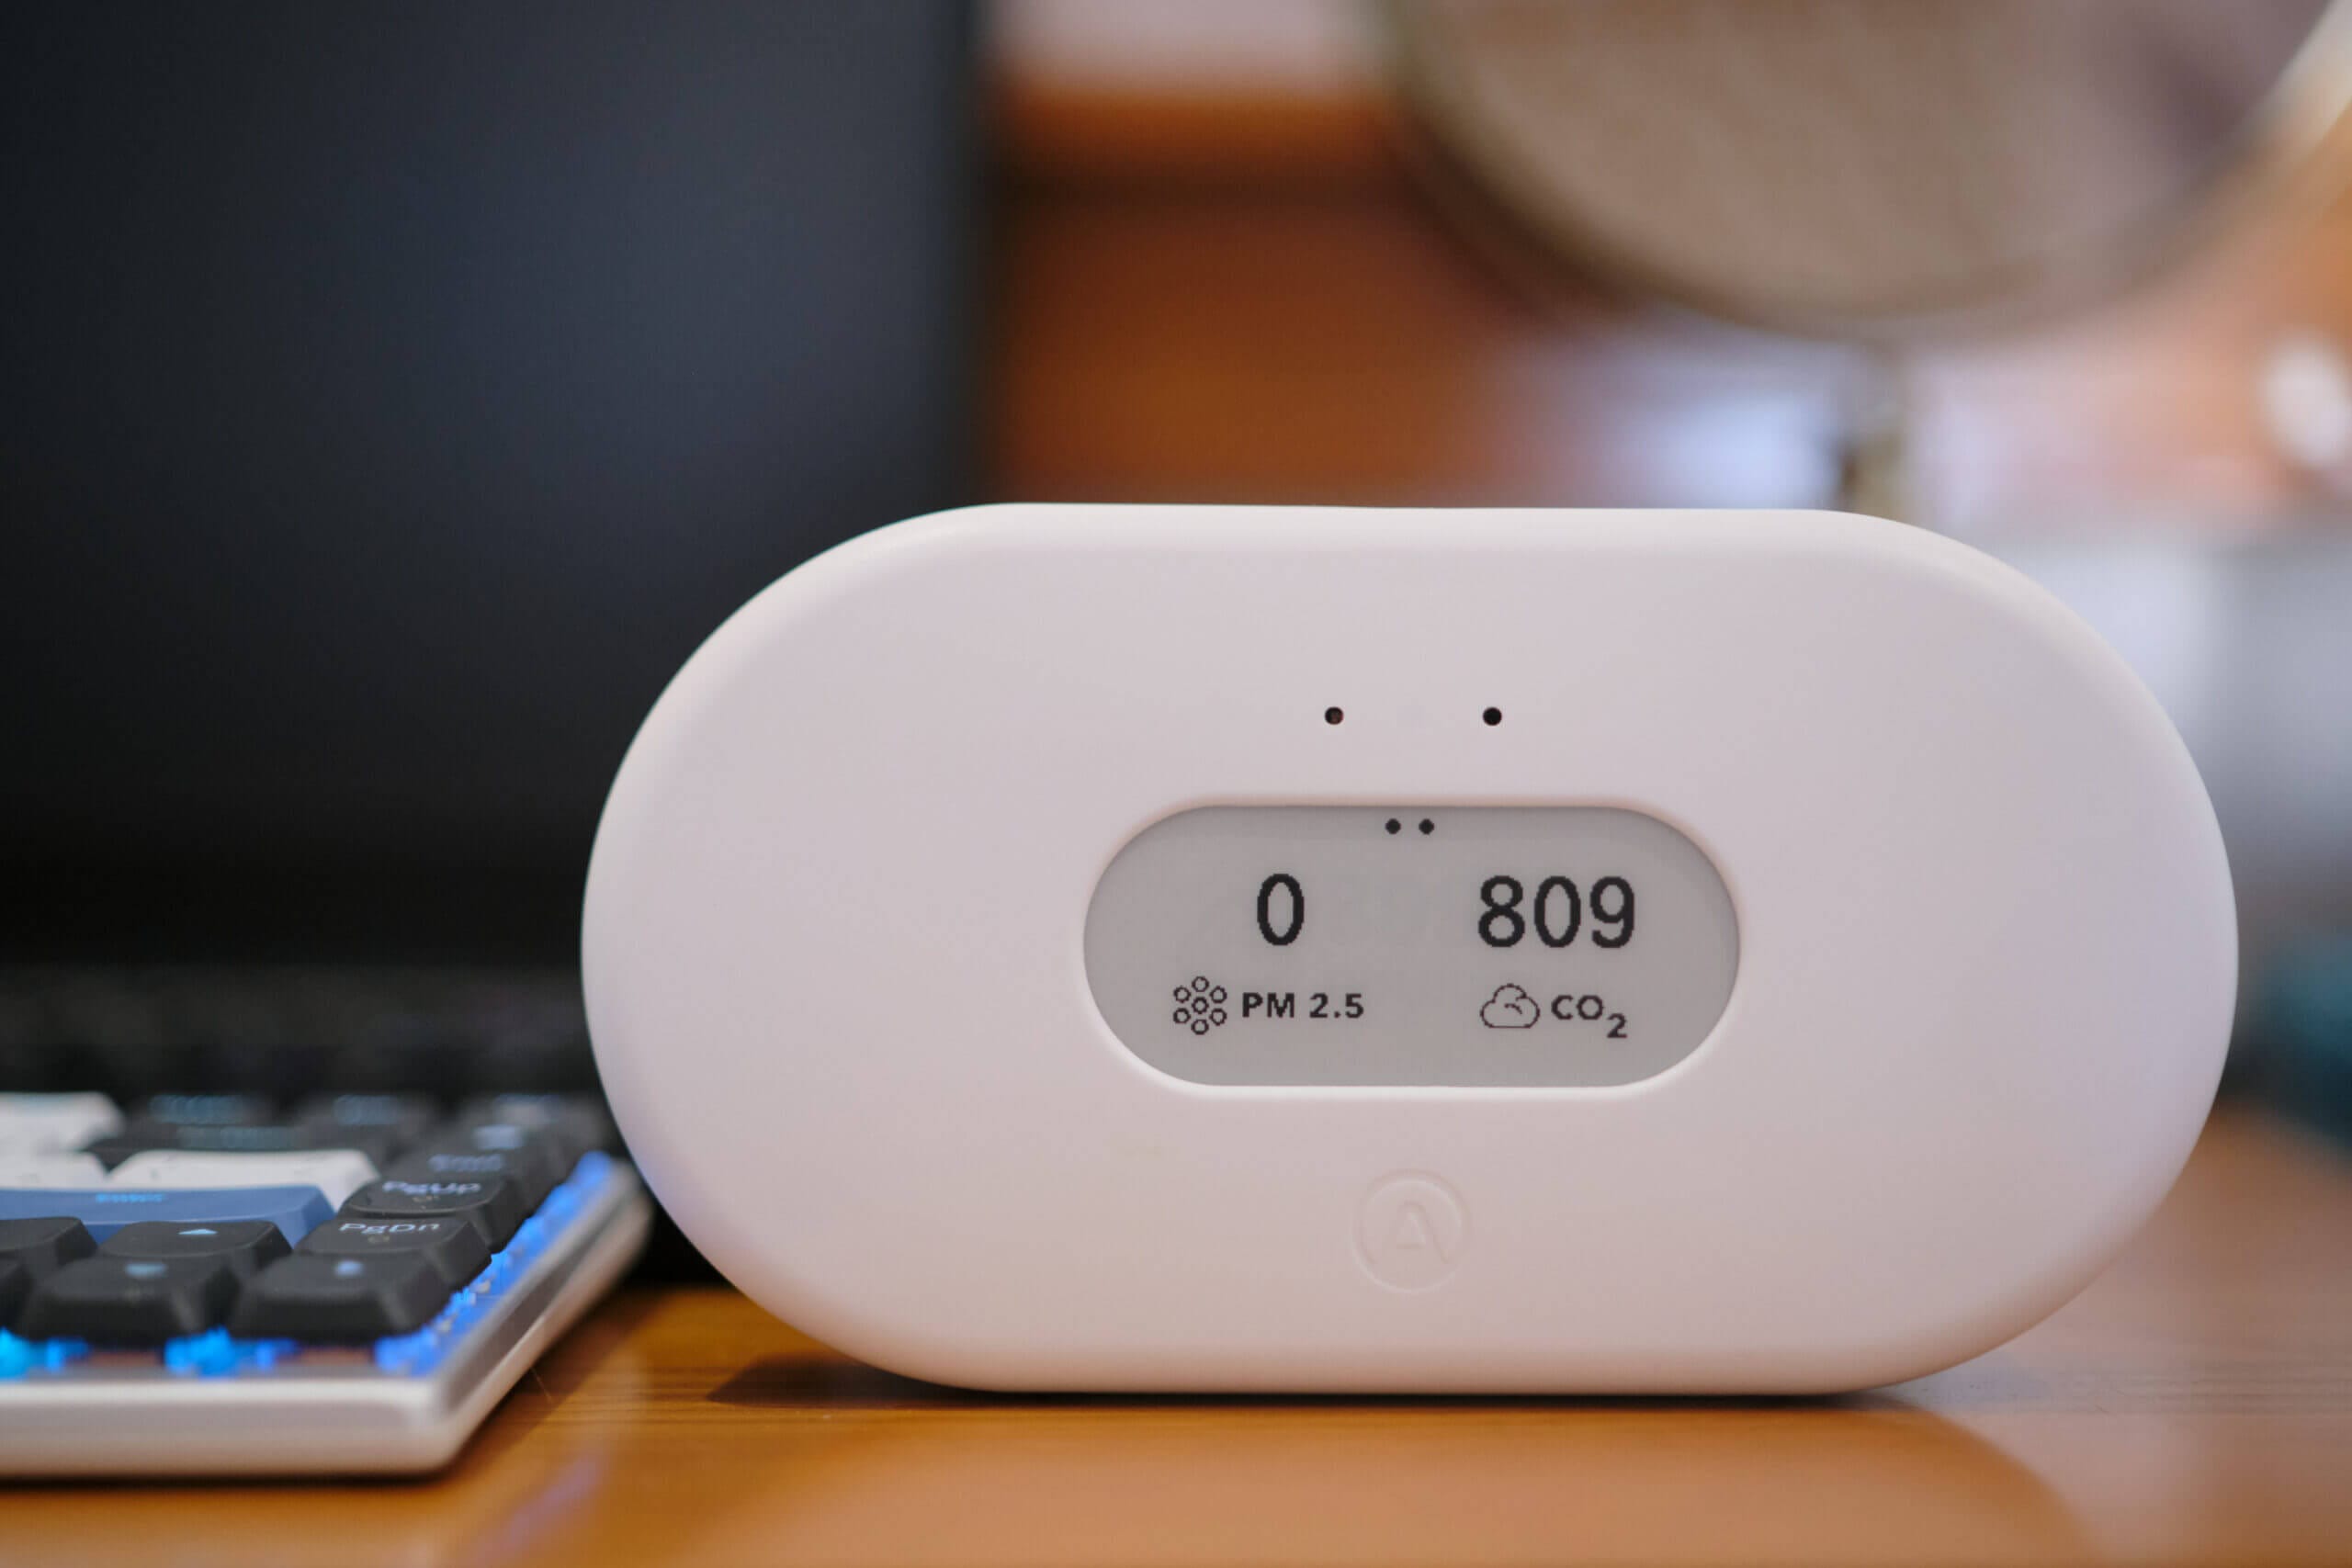
Instead, the PM2.5 screen is always shown second (unless you have that set to show on your home screen) before humidity appears third. For some reason, I can’t check any other measurements unless I use the app or set them to display on the home screen. Again, it’s not a big deal for me because I tend to use the app more, but this might prove frustrating for anyone wanting to check measurements with the device’s screen primarily.
I wish the app would allow you to choose which two variables to show on the home screen and set the order of the following screens whenever you wave at the device. Surely, this wouldn’t be hard to implement, and could it even be done via an update? I’m unsure, but I think it would be an easy fix.
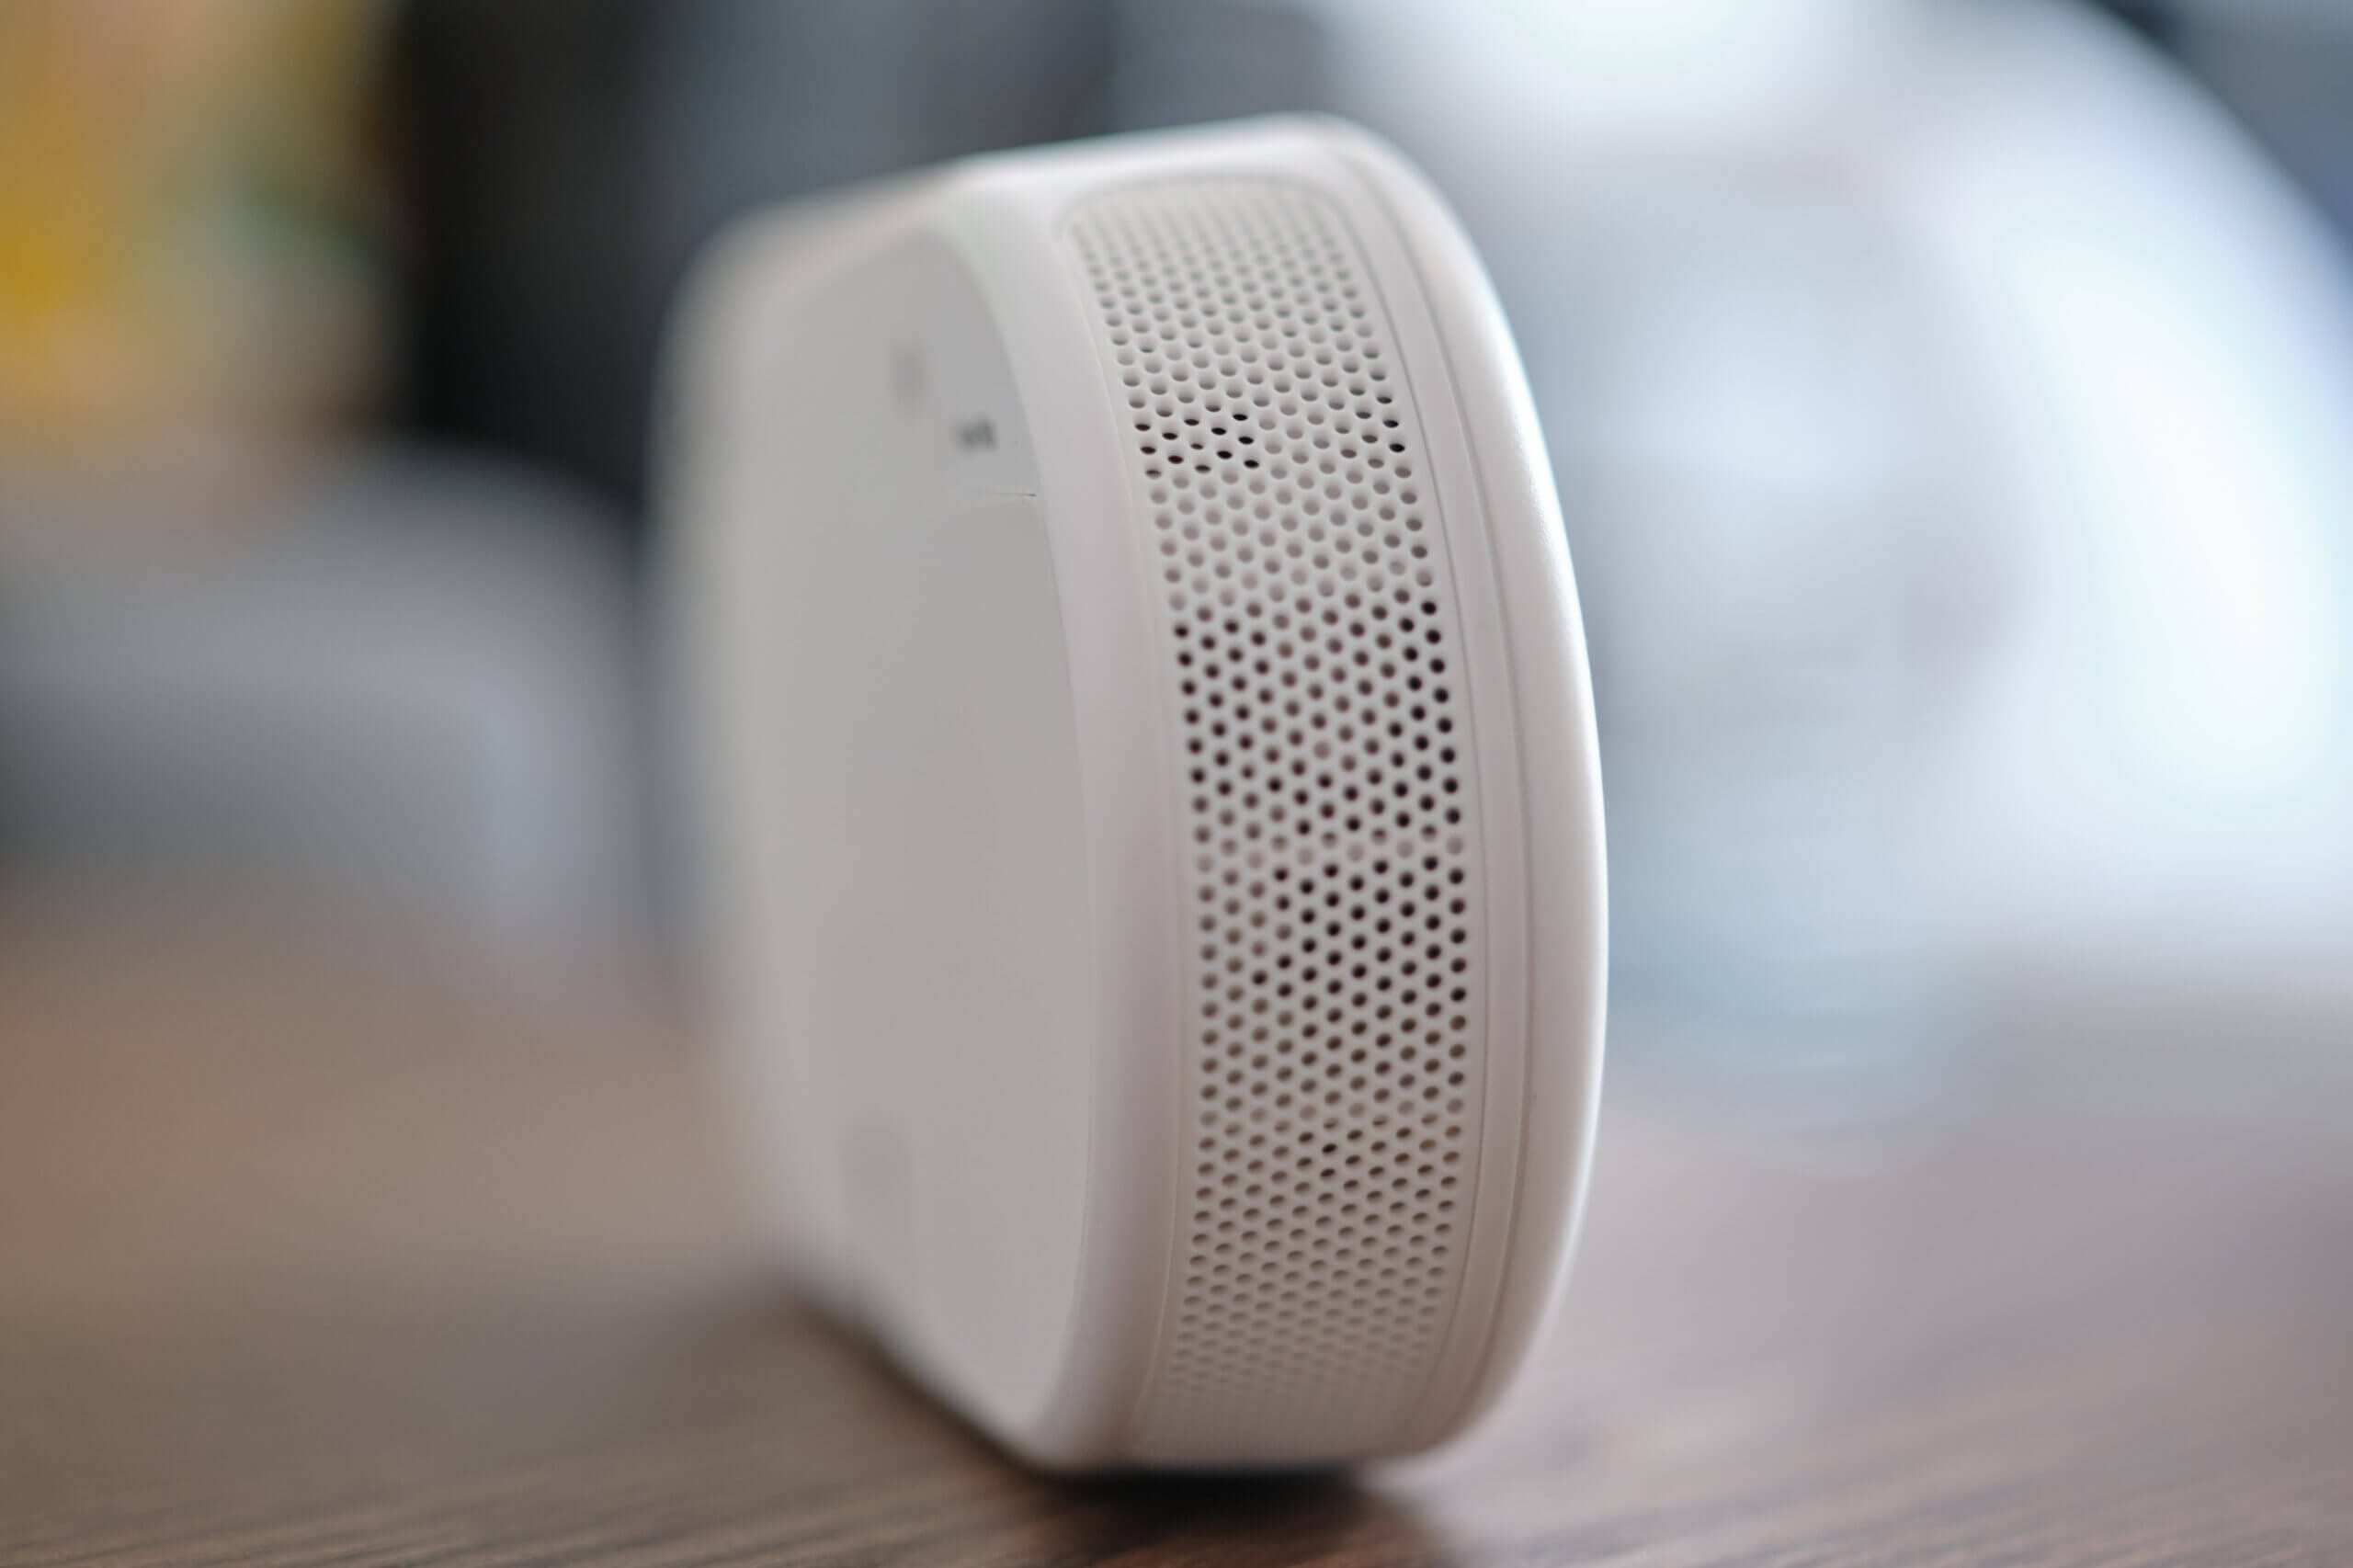
Turning the device around, you will find two large grills on the left and right of the device, making it look akin to a BlueTooth speaker (in fact, I’ve had people confuse it for one!). These vents allow air to access the device, which is essential for measuring air quality. Of course, this means that, like all air quality monitors, this monitor is not waterproof or water-resistant in the slightest.
Overall, I like the device’s design, but I think they sacrificed some functionality here to make it look nice (and be easy to use). If the screen was slightly larger, it could show more pollutants. At the very least, users should be able to select the order in which the pollutants appear. As it stands, the app is essential as you can only ever view your two selected pollutants, PM2.5 and humidity, on the device.
Connectivity & App
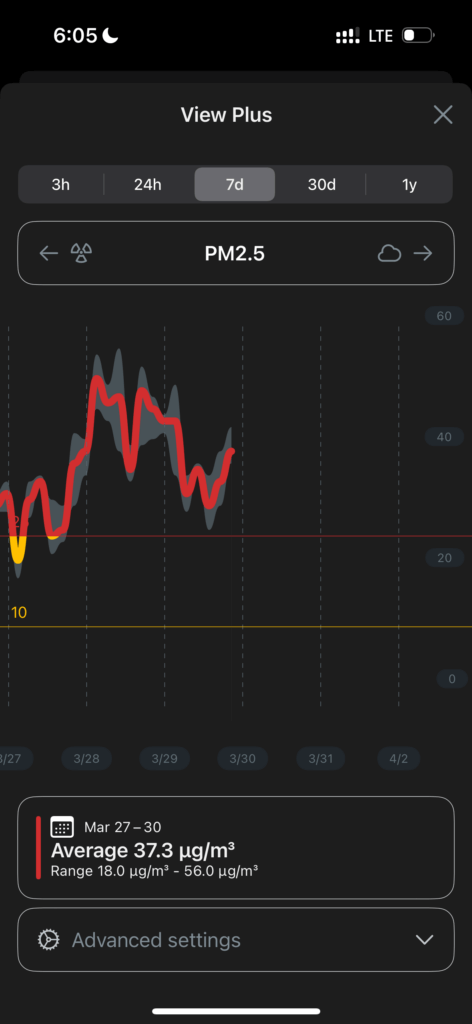
To get the most out of your Airthings View Plus, you will want to use either the web dashboard or the accompanying Airthings app. Both platforms offer similar functionality, and it comes down to how you would prefer to view your data – on a PC or a smartphone. You can use both simultaneously, so you can easily alternate between these options depending on your needs.
Once you create an account on the app (which is a very straightforward process) and register your monitor, you can proceed to the dashboard, where your monitor(s) data should already be ready to view. While I appreciate the app’s convenience, nothing compares with a full web dashboard when it comes to displaying and interpreting data.
Therefore, I use the app when I want a quick insight into my indoor air quality. However, if I plan on doing any further analysis, I will always opt for the web dashboard instead. While it’s common for monitors to have either an app or a dashboard, I appreciate having both as it allows me to choose how to interact with my View Plus at any given time.
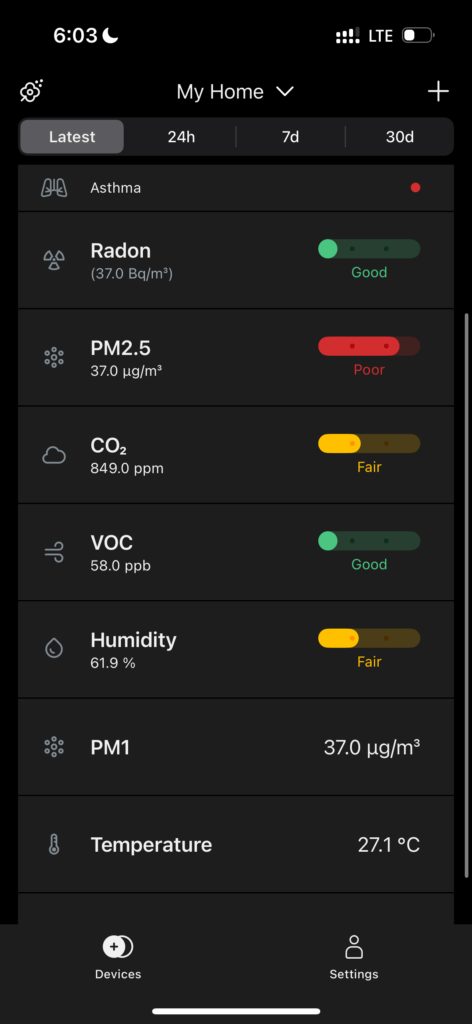
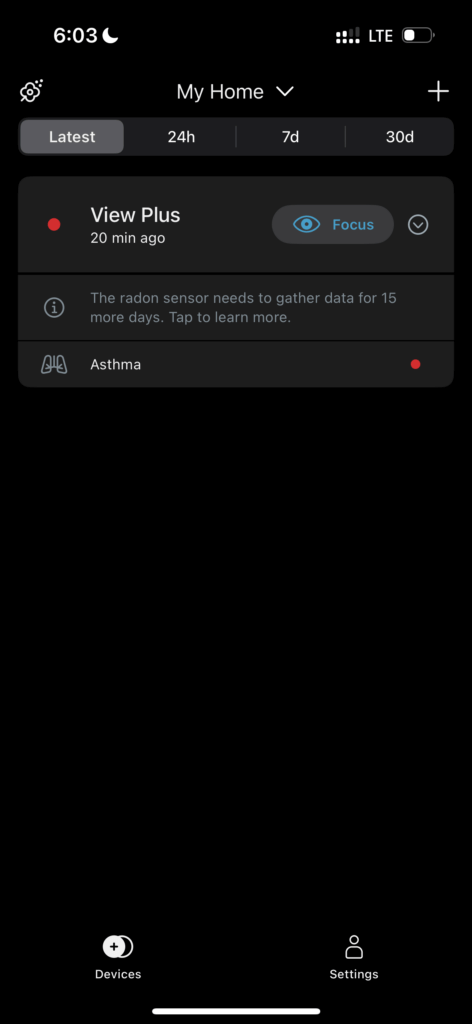
First, let’s discuss the app. On the home screen, you will find your device’s latest measurements. These will all be represented by colour-coded bars, which indicate the thresholds of good, fair, and poor air quality. Unfortunately, these thresholds cannot be changed. One element that I like about this home screen is that you can focus on things such as productivity, headaches, asthma, or sleep disruptors, and this will give you another measurement, which is an aggregation of factors that impact these conditions.
For example, I set asthma as my focus since I have it. Now, I get one reading that aggregates PM2.5, VOC, and humidity readings – all big factors in asthma. This is similar to the other focus settings, except it will prioritise different factors when giving an aggregate rating for those. For example, regarding productivity, CO2 is the most important factor to monitor.
If you’re using the device on battery power, this screen will update infrequently to conserve battery life. Unfortunately, if you want the most up-to-date data, you will need to power the device via the Type C port or physically view the device’s E-ink screen. While I understand the need to conserve battery life, it would be great to have an on-demand reading setting to request up-to-date concentrations when needed.
Interestingly, there is also a pollen screen that shows outdoor pollen levels based on information from BreezoMeter. While I appreciate the inclusion of this function, it appears to only be useful in the U.S., Canada, or Europe, as data is missing for most other locations. For example, I can’t get any information from this screen here in Vietnam.

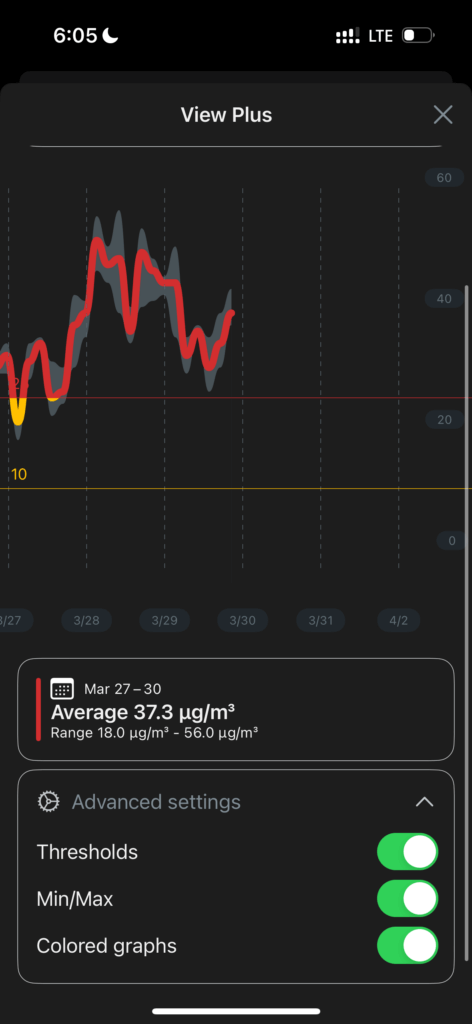
Moving on, you can view graphed data by tapping on any pollutant or environmental factor. This will bring you to a rather nice-looking graph for the selected variable, which is colour-coded and shows minimum/maximum values. It also includes a cursor that can be moved to show the exact concentration at any given time – something I recently complained about in my AIRVALENT CO2 Monitor review.
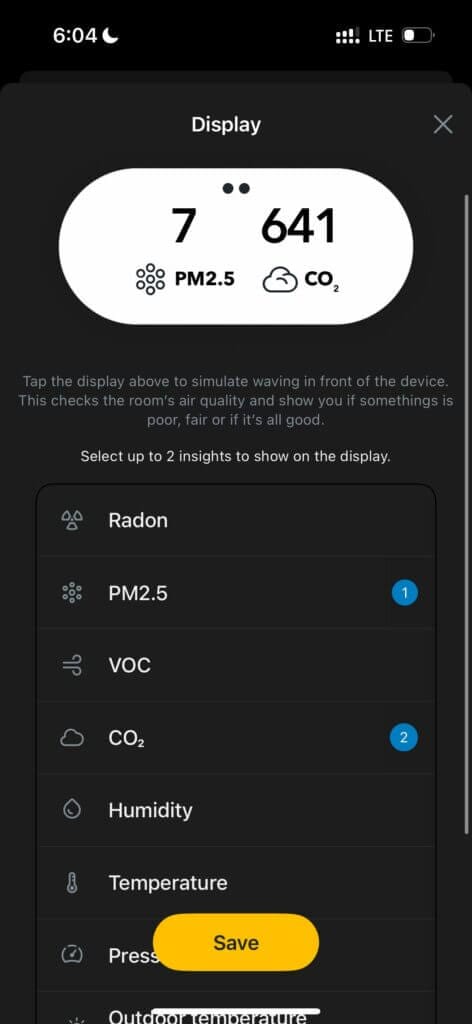
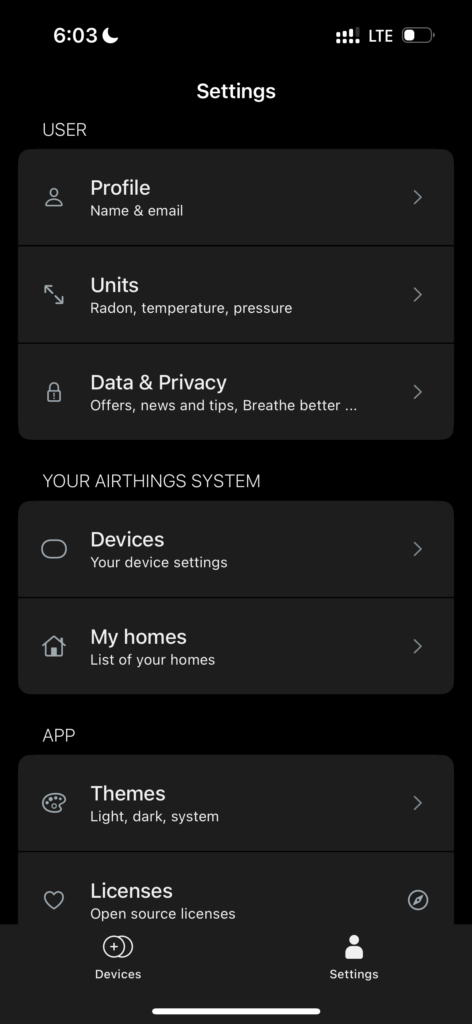
Finally, you also have a settings screen. From here, you can change your account settings and units, view privacy settings, set homes (important if you have many monitors), and also change a few device settings, such as the two pollutants visible on the home screen. Overall, I don’t mind this settings menu, but three big things are lacking for me – the option to adjust the order of pollutants shown, chance device thresholds, and an option to calibrate the CO2 sensor manually.
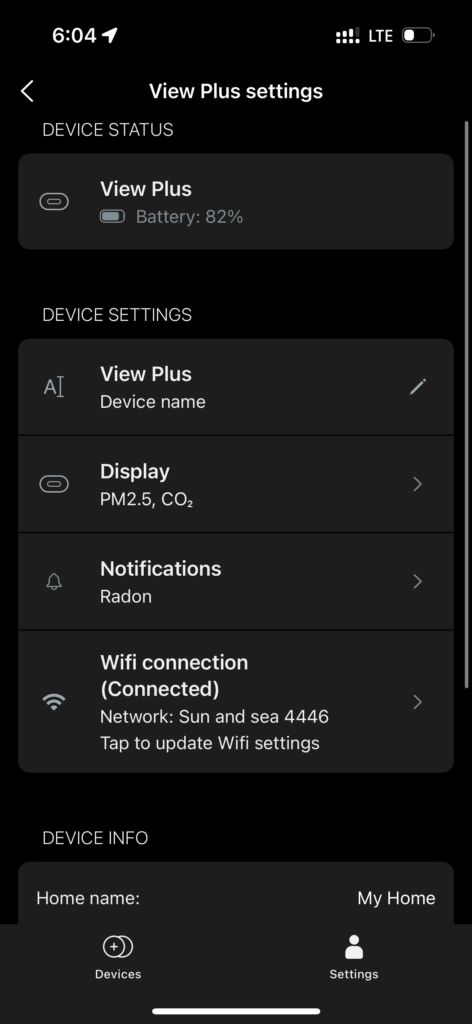
I discussed the first point in the design section but will quickly reiterate it here. While you can adjust the two variables on the home screen, you can’t change what appears or the order when you wave at the device. For example, unless I show radon on the home screen, I cannot view it unless I use the app or web dashboard. This seems like such an easy fix, and I wish I could set the order of the pollutants shown when I wave my hand.
Secondly, this device relies solely on automatic calibration for all its sensors. While manufacturers always claim this improves accuracy, it can cause issues as the device automatically adjusts its baseline values, particularly with the CO2 and VOC sensors. I’ve already covered this in more detail in the ‘accuracy’ section, but I believe this is a big oversight, and it’s a feature that should be added to the app – at least for the CO2 sensor.
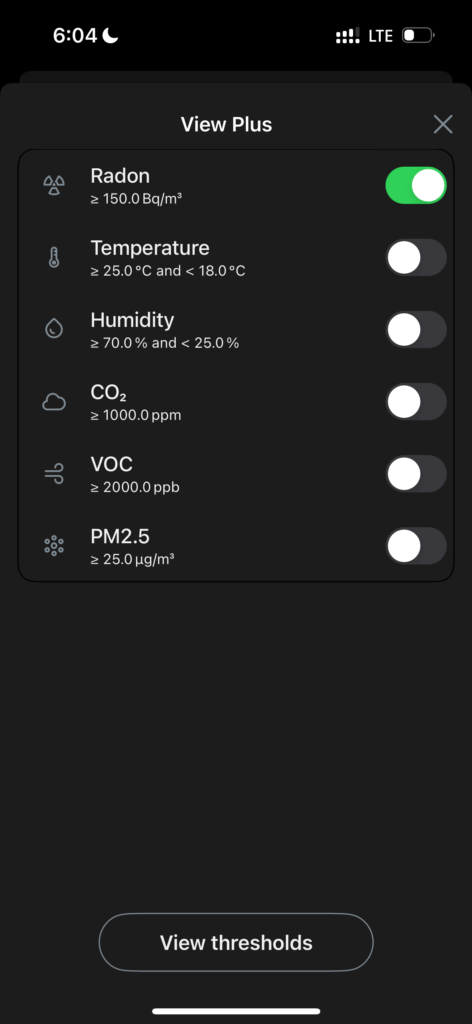
Finally, and very frustratingly, you can’t change the preset thresholds for the LEDs or phone notifications (which can be enabled or disabled). I think this is a very bad decision, and I can’t understand why they wouldn’t allow users to set these thresholds themselves. It’s great to have default values, but they should be adjustable, as I don’t want a notification every time my CO2 concentration exceeds 1000 ppm. 1400, perhaps, but not 100. Again, it seems like they tried to oversimplify the app for the sake of accessibility and instead removed a piece of (in my opinion) vital functionality from it.
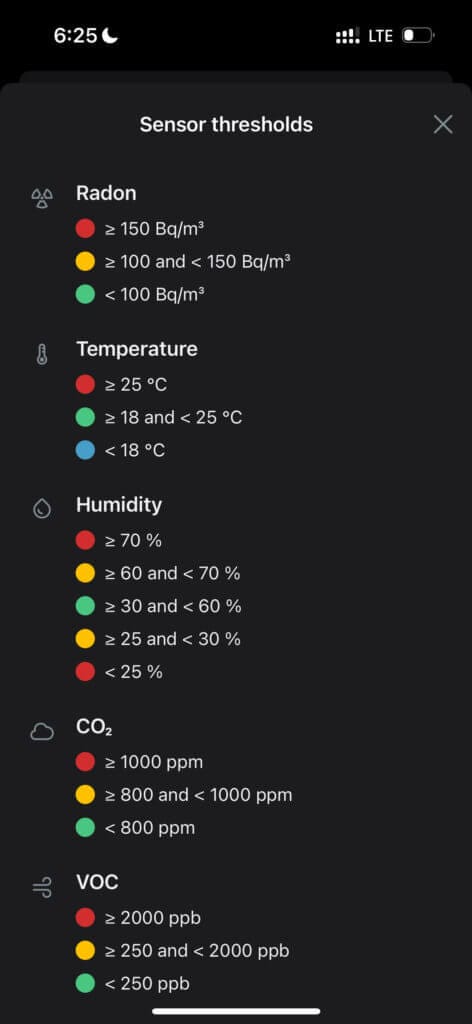
Overall, the app is very simple, and this is both a big strength and a significant weakness. I think this app will prove perfect for anyone wanting a straightforward device to use. However, it lacks some settings, and you should be able to adjust the order of screens, set custom thresholds, calibrate the sensors, and export data. Regarding data exporting, let’s look at the web dashboard, where you can export data to a .csv!
The web dashboard is another way to view the data from your Airthings View Plus. It also allows you to change some settings – but only the same settings you can adjust on the app (with the exception of adjusting the uploading interval while on battery, which can only be changed on the dashboard). While the functionality of both platforms overlaps, I appreciate having the web dashboard for two reasons: first, you can much more quickly view data here, and second, you can export data.
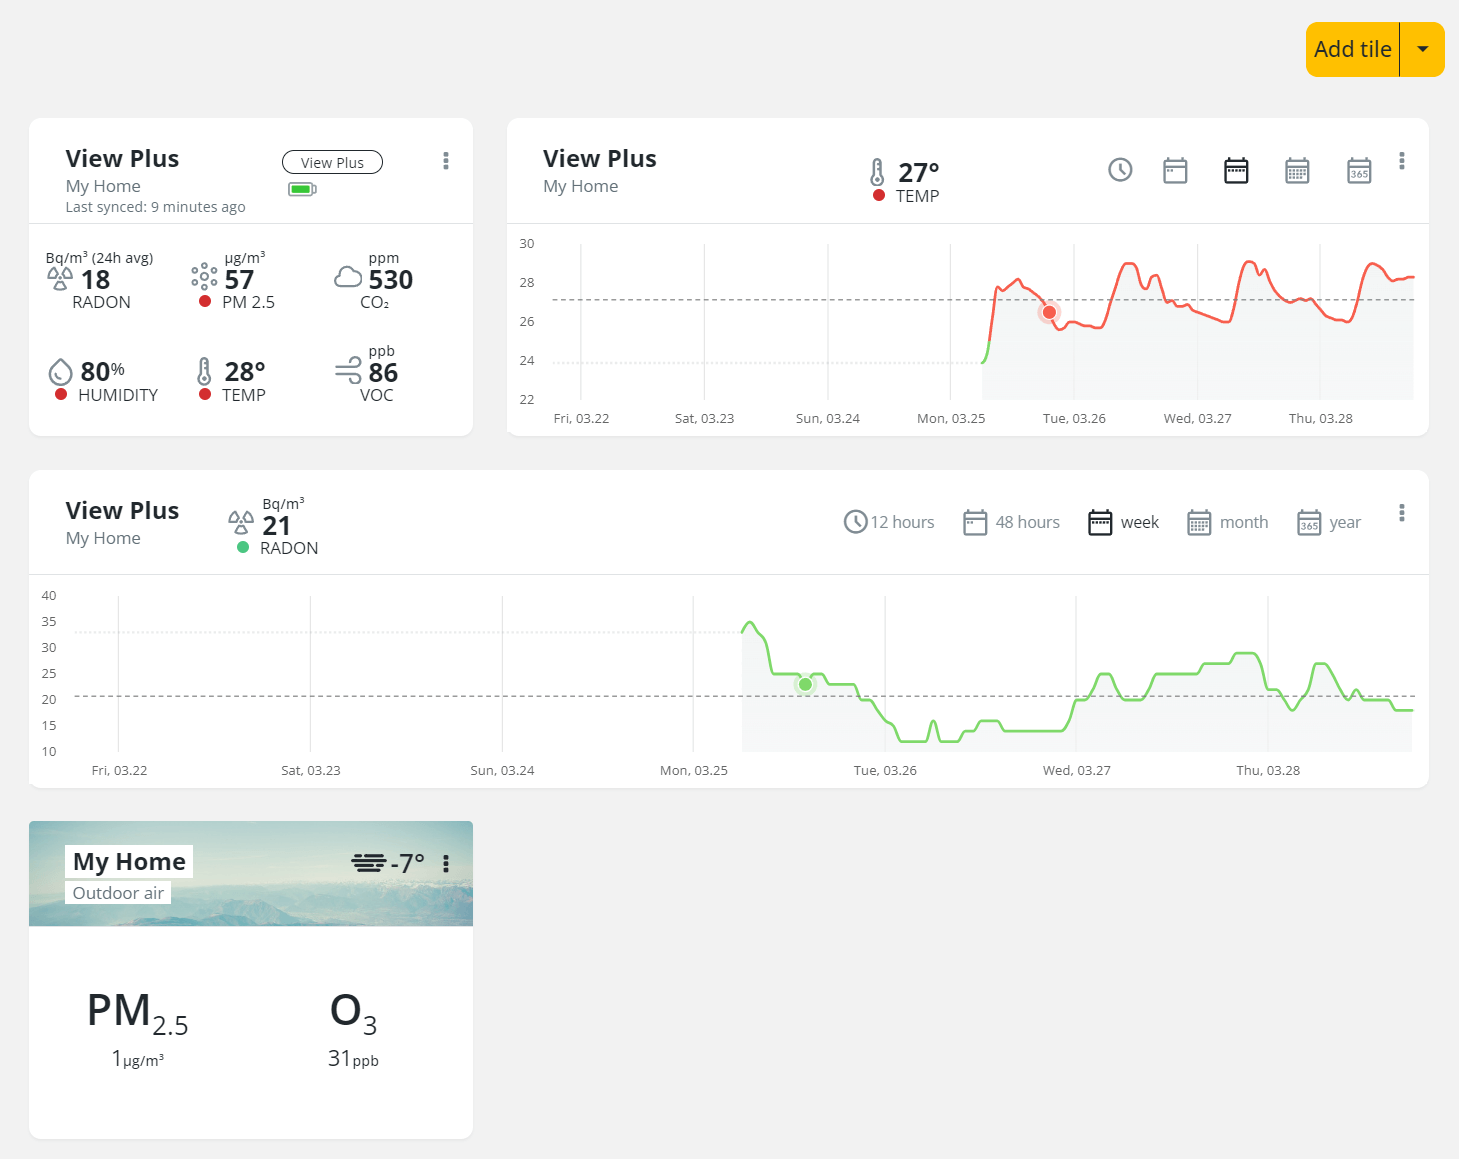
Unfortunately, this leads me to another caveat with the device. While you can export data, the formatting is horrible and very frustrating. Unlike devices such as the Aranet4 Home (and every other air quality monitor that I can think of), which export each variable in a different column, Airthings thought it was a good idea to export only one column. This means that your PM2.5, CO2 and VOC concentrations, along with temperature, pressure, and every other sensor in the device, are all in one column and divided only by time.
As you can see in the ‘accuracy’ section of this article, I had to make a lot of graphs for this article, and the only way that was possible was by using AI first to sort the data and create a well-formatted spreadsheet. This is a frustrating extra step that I shouldn’t need to do, and surely a quick update could fix this. I appreciate having the ability to export data, but it should be so much simpler than this, and nearly every other air quality monitor does this right.
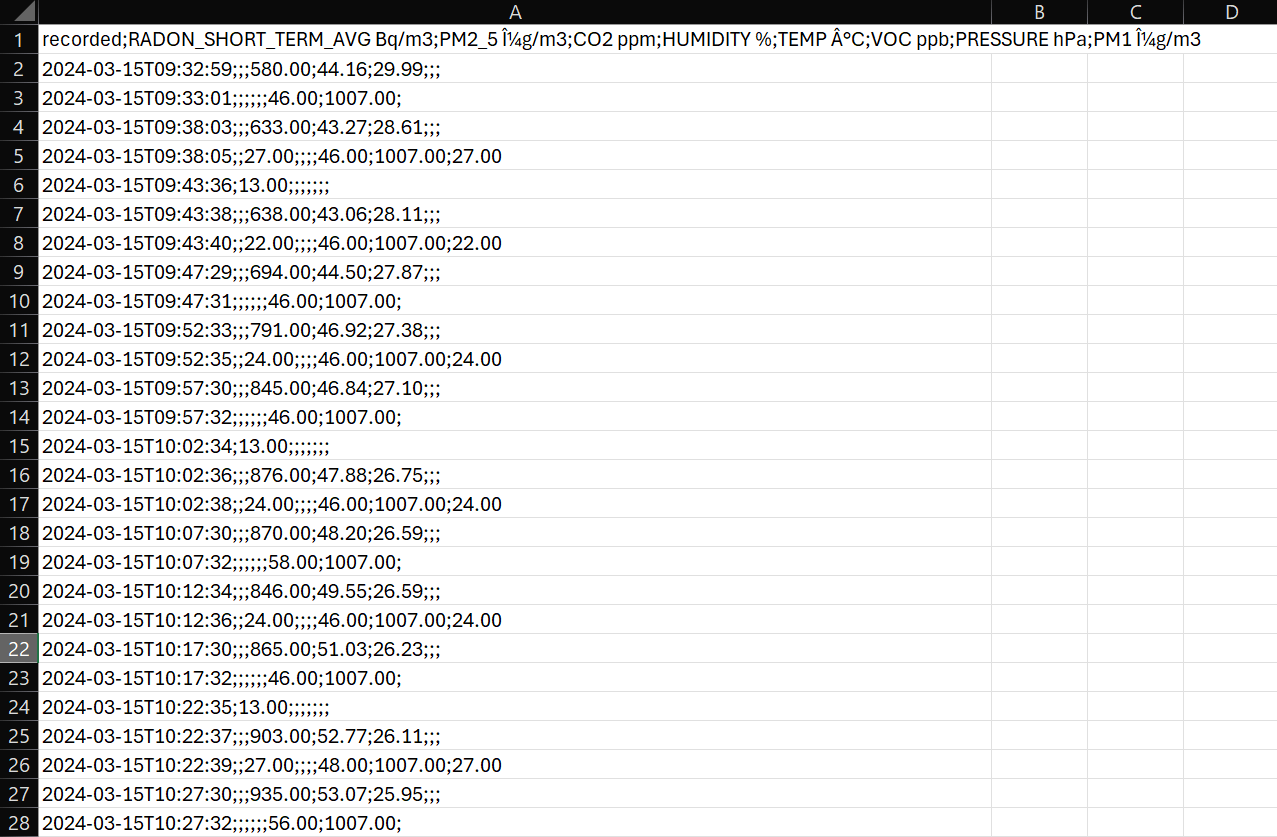
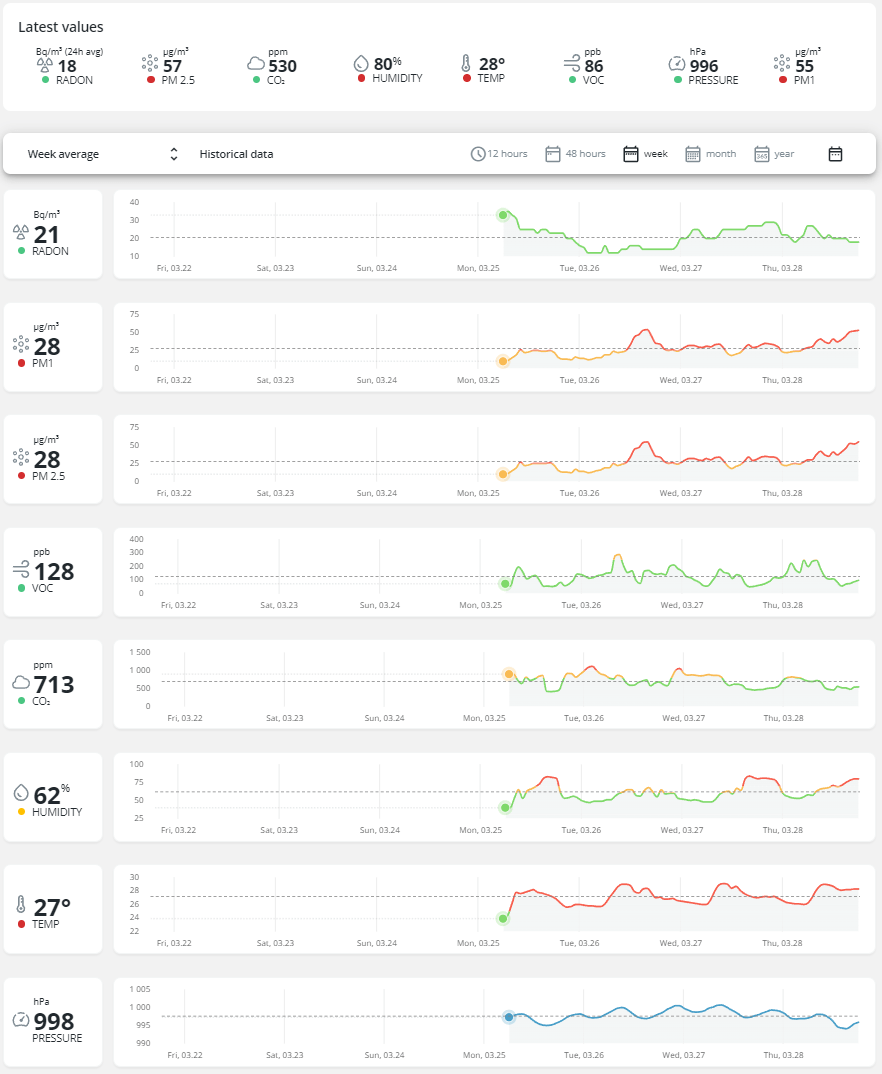
Moving on, let’s discuss the rest of the web dashboard. If you are interested in viewing your monitor’s data in more detail, you will likely use this web dashboard frequently. It’s very nicely laid out, and I honestly like it a lot, minus the data exporting issue. It’s far less feature rich than other dashboards such as those from CO2.Click and AirGradient, but again, this shows that Airthings is not targeting enthusiasts but trying to create an accessible and easy-to-use air quality monitor, which I can appreciate.
Finally, I would be remiss not to mention that the View Plus can also act as a hub and integrate into your smart home ecosystem. If you already have Airthings Wave devices that only support Bluetooth, you can connect them to your View Plus, but only when powered, to access the data from those devices on the web dashboard. This is a handy feature, and it gives WiFi capability to the otherwise Bluetooth-only Wave series.
The View Plus also supports Alexa, Google Assistant, IFTTT and other smart home systems. However, I haven’t had a chance to experience this side of the device as I don’t use any of these platforms. If you’re interested in this side of the device, please check out some other reviews or ask the question on this post for others to answer.
Pricing & Competition
The Airthings View Plus is a premium monitor with a regular price of $299 USD. This is quite pricey and puts it in the same ballpark as other premium monitors, such as the uHoo Air Quality Monitor and AirVisual Pro. While this price will put it out of range (or interest) for some people, others don’t mind paying the higher price for a good product.
Now, I will mention straight away that you can get great monitors for far cheaper. For example, the Qingping Air Quality Monitor and Air Quality Monitor Lite are fantastic options at $90 and $130. However, they don’t have the same range of sensors as the View Plus. At a slightly higher price tag ($130 or $190 depending on if you purchase the DIY kit or not), you have the AirGradient ONE, which is a fantastic indoor air quality monitor and my current favourite. While it doesn’t monitor radon, it has other advantages, such as full customisation of every aspect of the device because it is open source.
At $229, you get the other comprehensive monitor from Airthings, the Wave Plus. While this monitor doesn’t have the PM2.5 sensor that can be found on the View Plus, it shares the other sensors (and even has a better CO2 sensor) and excellent connectivity. While I haven’t had the chance to review the Wave Plus, I’ve heard great things about it and believe it to be another good monitor.
Of course, this is to mention only a few monitors out there. There are so many that I didn’t include, and many of these are lower-cost. At $300, I consider the View Plus to be in the top pricing tier for an air quality monitor—at this price, the monitor needs to be good to warrant the price. For this reason, I recently harshly reviewed the IQAir AirVisual Pro, as I simply don’t believe it’s worth the price tag.
I have a different opinion about the View Plus. This monitor offers a far more solid arrangement of sensors in a package that feels very modern and not outdated, like the AirVisual Pro. While there are cheaper options out there that perform very well, few of these share the big advantages of the View Plus.
What are these advantages? Well, for one, it’s hard to find a monitor with the range of sensors the View Plus has alongside a radon sensor. Furthermore, I love the fantastic battery life of the monitor, which is almost unheard of in an air quality monitor (but not so much in a carbon dioxide monitor). These advantages, along with the ease of use and high build quality, will justify View Plus’s price for many people.
If it were for me, I would probably opt for a cheaper monitor alongside a separate radon/ionising radiation sensor, which would still be cheaper than the View Plus alone. However, if a family member asked for a recommendation, I could easily see myself recommending the View Plus as it’s accurate and exceptionally easy to use. At the end of the day, this is what it will come down to for many people – do you mind paying a bit more for a great user experience, or would you prefer to pay less and get a monitor that might be slightly rougher around the edges? Either way, I don’t think there’s a wrong decision here.
One other factor worth mentioning is the device’s support. If you’re paying this much for a device, you hope for great support, and it appears that Airthings has at least good support. While I haven’t interacted with them myself, as my monitor has worked without issue, I’ve read through a few Reddit threads, and it appears that their customer support team is generally prompt and helpful.
Conclusion
So, where does that leave me regarding the Airthings View Plus? Well, I have two minds about this device, and I will explain why. On the downside, I don’t think this is a great device for air-quality ‘enthusiasts’ who know what they want in an air-quality monitor and want the ability to have control over the device. The lack of user-adjustable thresholds, manual calibration, and the odd data export format lead me to conclude that, while great for beginners, this monitor isn’t ideal for people such as myself.
That leads me to the other half of my conclusion – if you want a simple monitor that just works, or if you’re recommending an air quality monitor for a friend or family member who doesn’t have much experience with air quality, this device seems to be the perfect fit. Some users want a device that works well out of the box and might not know what thresholds of pollutants are considered harmful or hazardous. That same group of users probably will never export data while using the device. For this group of people, the Airthings View Plus is perhaps the best monitor I’ve come across to date.
With that said, I think Airthings should roll out some app/dashboard updates for the View Plus. Right now, they’ve decided to focus their monitor entirely on simplicity, and in doing so, they’ve skipped out on many important features. However, this doesn’t need to be the case. Why does the monitor need to be one or the other? Why not just add an ‘advanced’ menu to the app with these extra features? Or, they could even be exclusively on the web dashboard, which I assume most users will very rarely use, if at all.
So, if you want a monitor that is accurate, easy to use, and has good support (or so I’ve heard), the View Plus should absolutely be a monitor you check out. However, if you want or need more advanced features, you will want to look at other monitors that better suit your needs.
Airthings View Plus FAQ
What Does the Airthings View Plus Monitor?
It monitors PM1.0, PM2.5, CO2, VOCs, radon, temperature, humidity, and atmospheric pressure.
What Alternatives Are There to the Airthings View Plus?
There are many alternatives in different price ranges. Check out this article on the best air quality monitors for more information.
Is the Airthings View Plus Worth It?
This is a great choice if you want a simple monitor that works seamlessly.
Where Can I Buy the Airthings View Plus?
You can purchase it from Airthings or Amazon.
Is the Airthings View Plus Accurate?
Yes, I’ve found it to be accurate in my testing.
Have Questions or Comments?
Join the discussion on the BreatheSafeAir Community Forum. Ask any questions you have about air quality or adjacent topics and get quick answers!
Airthings View Plus
The Airthings View Plus is the top-of-the-line air quality monitor from Airthings. In this full review, we will investigate the accuracy and usability of this indoor air quality monitor.
Product Brand: Airthings
3.5
Pros
- Accurate sensors
- Easy to use
- Great connectivity
- Straightforward setup
- Good customer support
- Good range of sensors
- Smartphone and web dashboard
Cons
- Lacks some advanced features
- Expensive
- Lack of customisation
