Over the years I’ve run BreatheSafeAir, I’ve written extensively on air pollution. While most of my articles are broad, I’ve also written specifically on air pollution in a few countries, such as South Korea, the Philippines, Vietnam and Thailand. However, while I haven’t written about these experiences (yet!) I’ve also travelled to many other countries known for poor air quality, such as Vietnam and China.
After visiting cities that often top IQAir’s top 10 for most polluted cities in the world, such as Ho Chi Minh, Hanoi, Chang Mai, and Seoul, I felt that I had become somewhat used to living with air pollution as it has quickly become a part of my everyday life in these cities. I couldn’t have been more wrong.
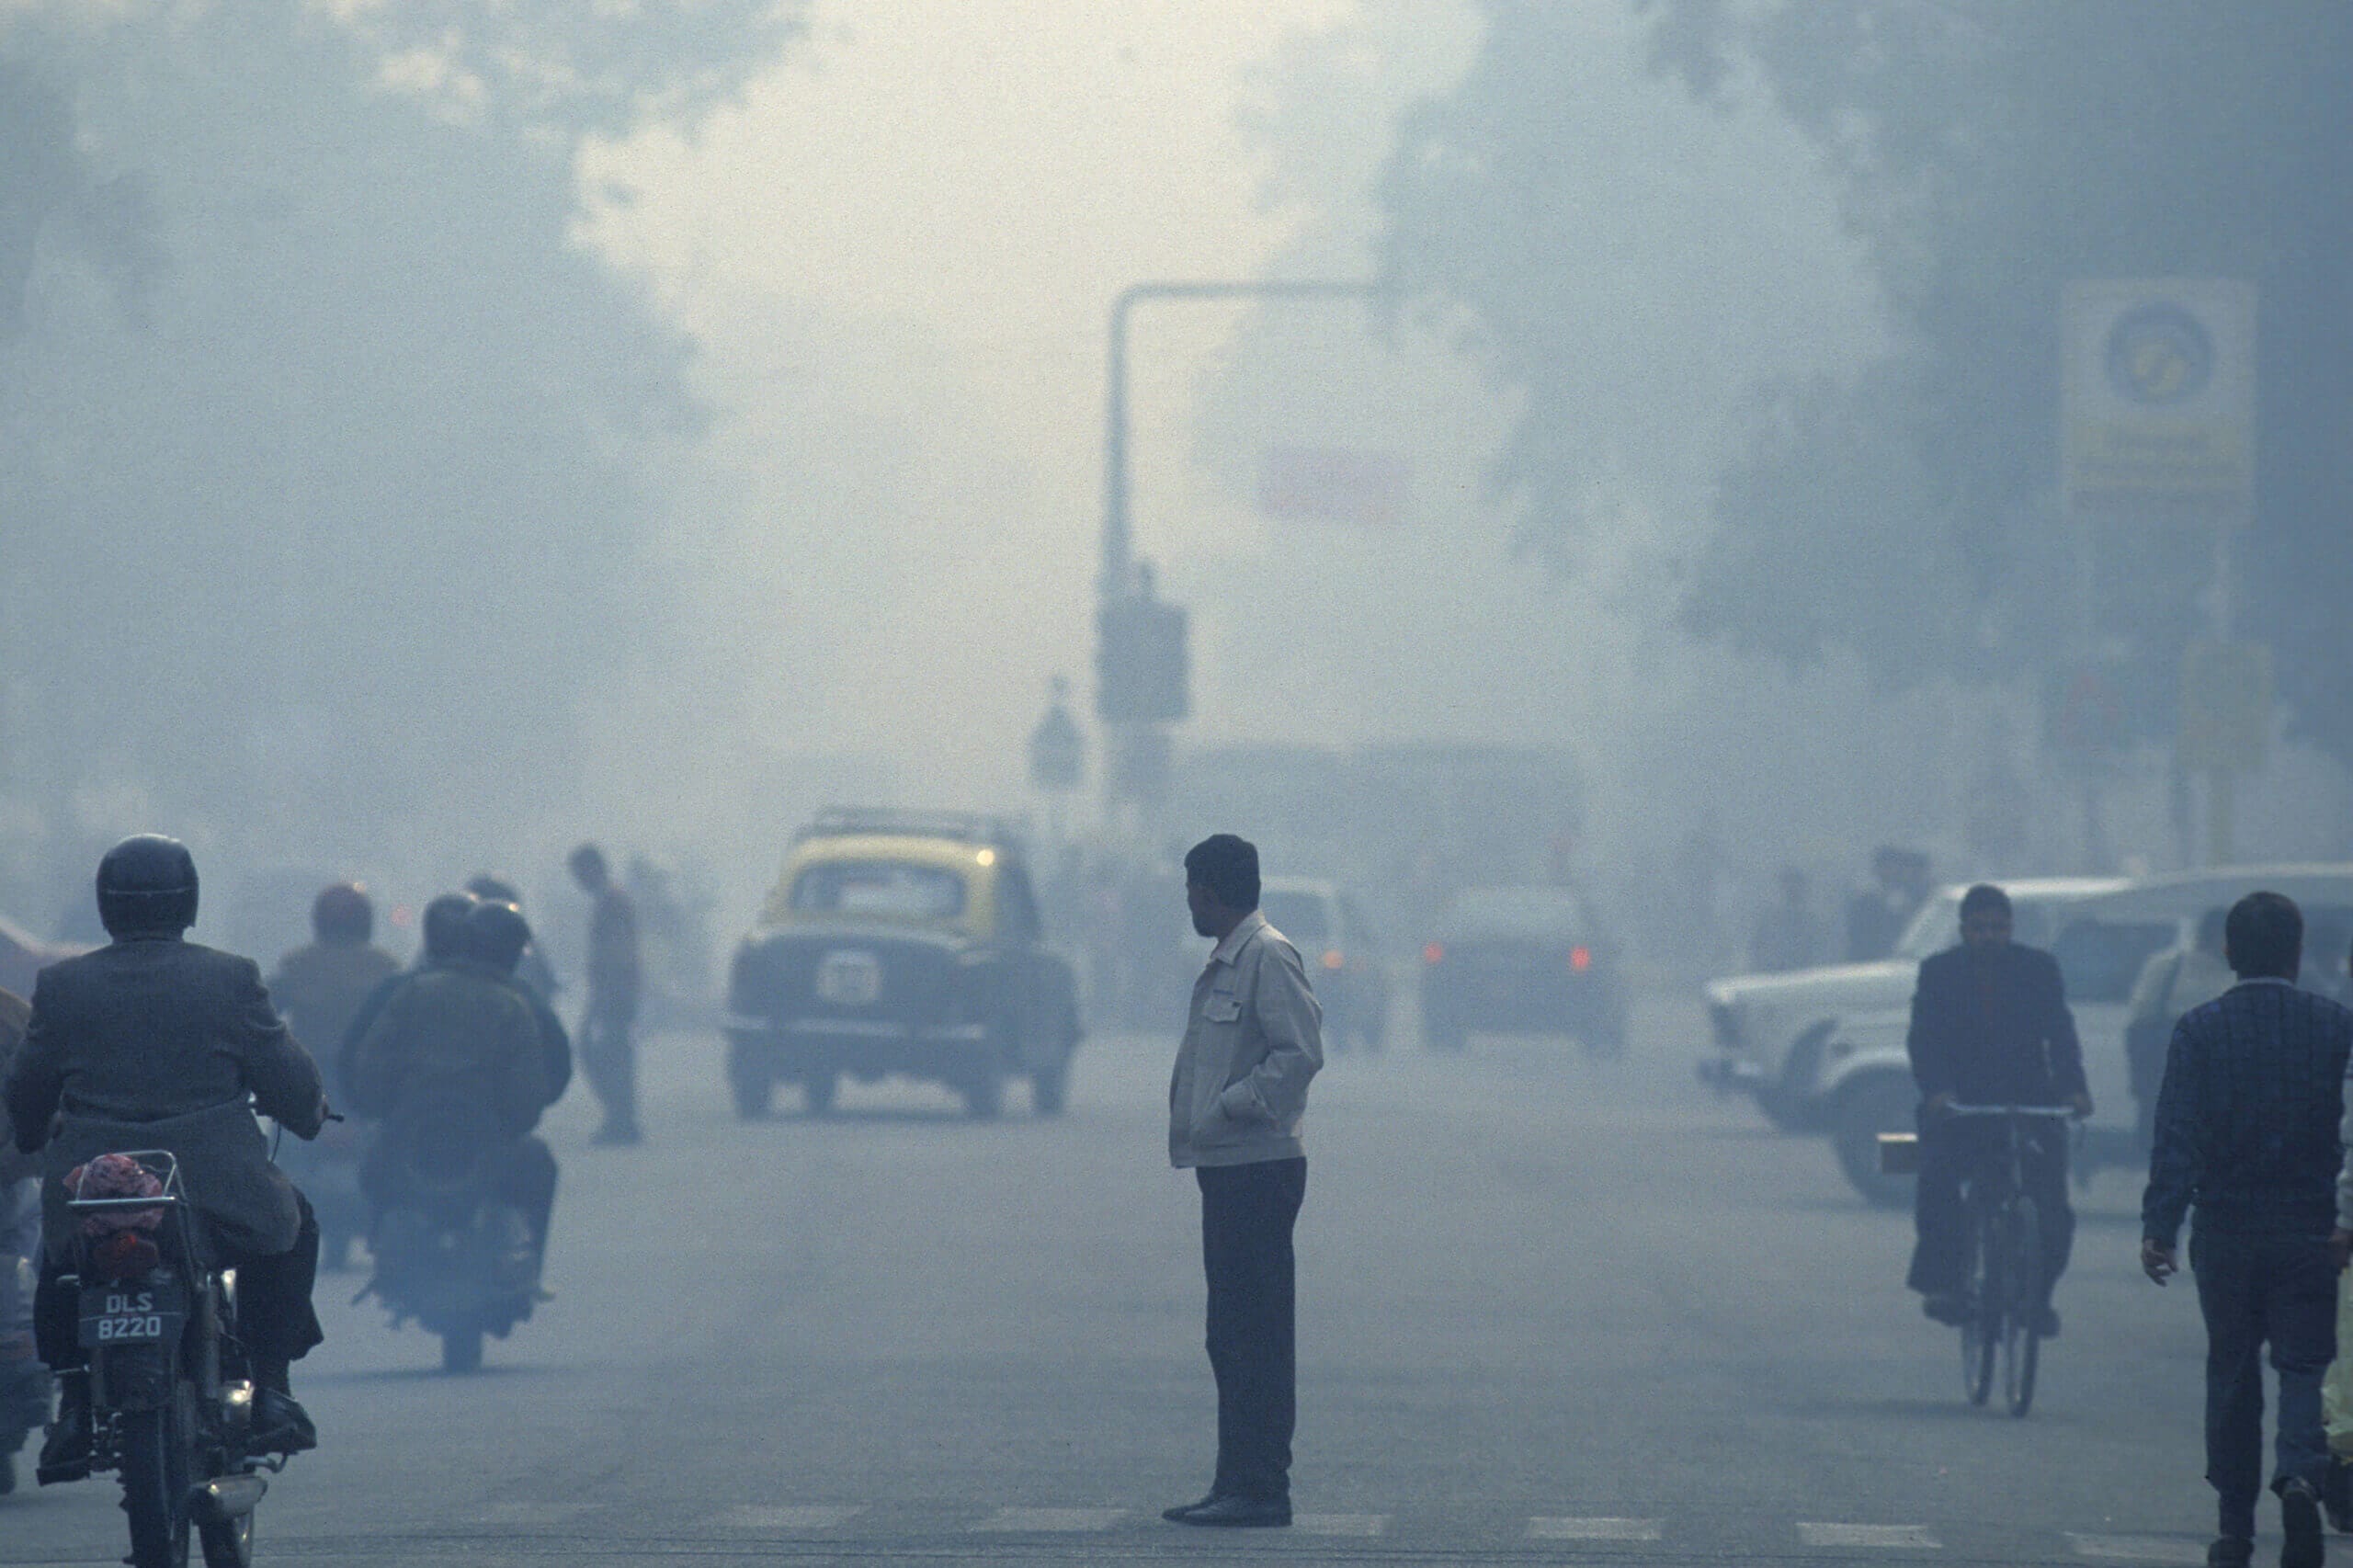
This year, I finally got to visit India for the first time. After many years of wanting to visit, a friend’s recent wedding gave me the push I needed to go. While I had a great time in India and would love to go back as soon as the opportunity arises, there’s one thing I don’t miss – the constant overwhelming and suffocating air pollution.
Where air pollution in other countries I’ve visited had occasional respites – usually due to weather such as rain – the air pollution in many Indian cities I visited was consistent and almost never-ending. To put this into perspective, New Delhi has more days at hazardous levels of air pollution (300+ on the U.S EPA AQI scale) than at ‘safe’ levels ( < 50 on the AQI scale).
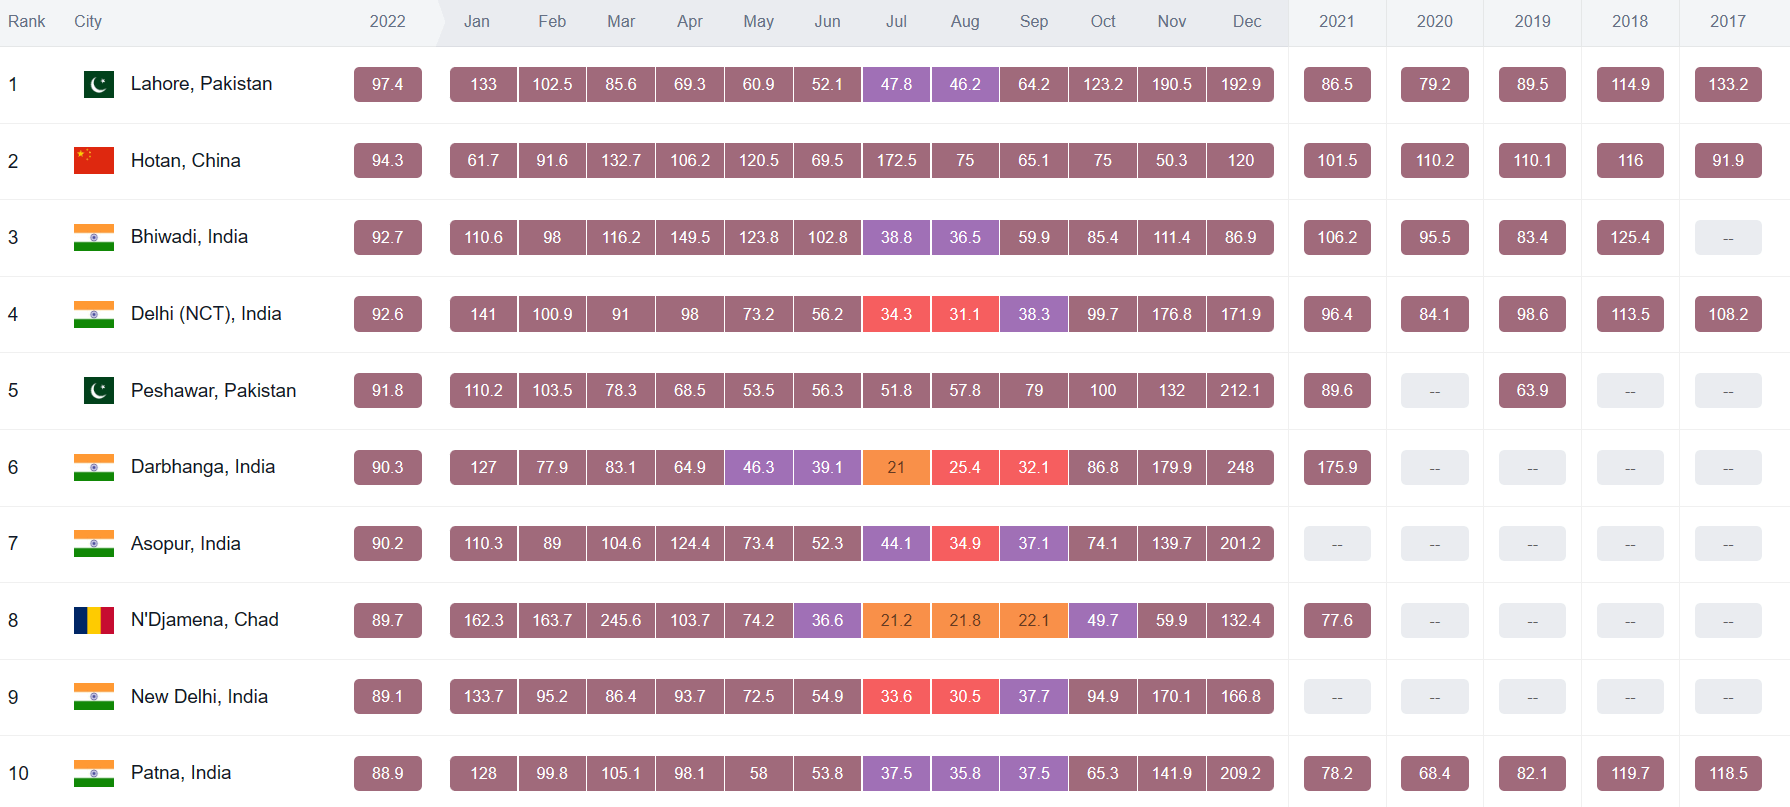
The table above is from IQAir’s list of the most polluted cities in 2022. As you can see, India has the most cities on this list, with six in the top ten. The list is completed with two cities from Pakistan, one Chinese city, and one in Chad. As is instantly apparent from this graph, India has a severe air pollution problem.
“In the most recent month, November 2023, New Delhi had 11 days at hazardous air quality levels (the worst measured on the AQI scale) and not a single day at ‘unhealthy’ levels or below.”
While my time in India was relatively short (I spent around two weeks in New Delhi, one week in Chennai, and one week travelling), I quickly saw how much air pollution impacts the lives of locals, and I wanted to write about it. This article has been written after extensive research and aggregates news articles, research, and more into one complete guide on air pollution in India.
Whether you’re here because you want to know more about the air pollution issue in India after seeing some recent news headlines, or you’re thinking of heading to India to visit or live, the air pollution issue is something you must be aware of. While India is a beautiful country to visit, and I recommend you visit if you get the chance, it’s vital to be mindful of the severity of the air pollution as you will no doubt be impacted by it.
Subscribe to BreatheSafeAir
Air pollution is a silent killer that affects millions of people worldwide. Start protecting yourself today.
This post contains affiliate links. For more information, please refer to my affiliate disclaimer.
Information on this blog is for informational purposes only. Readers are encouraged to confirm the information herein with other sources. Furthermore, this information is not intended to replace medical advice from professionals. This website assumes no responsibility for the accuracy of the information, which is subject to change without notice.
Air Pollution in India
Is Air Pollution in India an Issue?
On IQAir’s AirVisual platform, nearly every day, there are at least two or three Indian cities in the top ten most polluted cities. Chances are, New Delhi is in the top five. Unfortunately, seeing the Indian flag on the list of most polluted cities is, at this point, virtually guaranteed.
If you’ve read this far, you’re likely already aware of how severe the issue of air pollution in India is. However, while many people understand that air pollution is a big issue in India, comparatively few know why it is such a big issue. After all, the air in which you can visibly see dust can’t be healthy, but exactly how bad is it?
I always try to be careful in these sections because I don’t want to seem like I am fear-mongering or exaggerating the issue. At the same time, it’s hard to convey just how serious the problem is without discussing very worrying facts. To stay on topic and present my findings objectively, I will present some numbers discussing how severe air pollution in India is.
Firstly, let’s take a look at the air quality index. The screenshot below was taken during the afternoon in November, showing the severity of the air quality crisis in India. Based on the U.S EPA air quality index (we will discuss the differences between the Indian NAQI and U.S. EPA AQI index later in this article), green represents ‘good’ air quality, with red, purple and maroon representing unhealthy, very unhealthy and hazardous air, respectively.
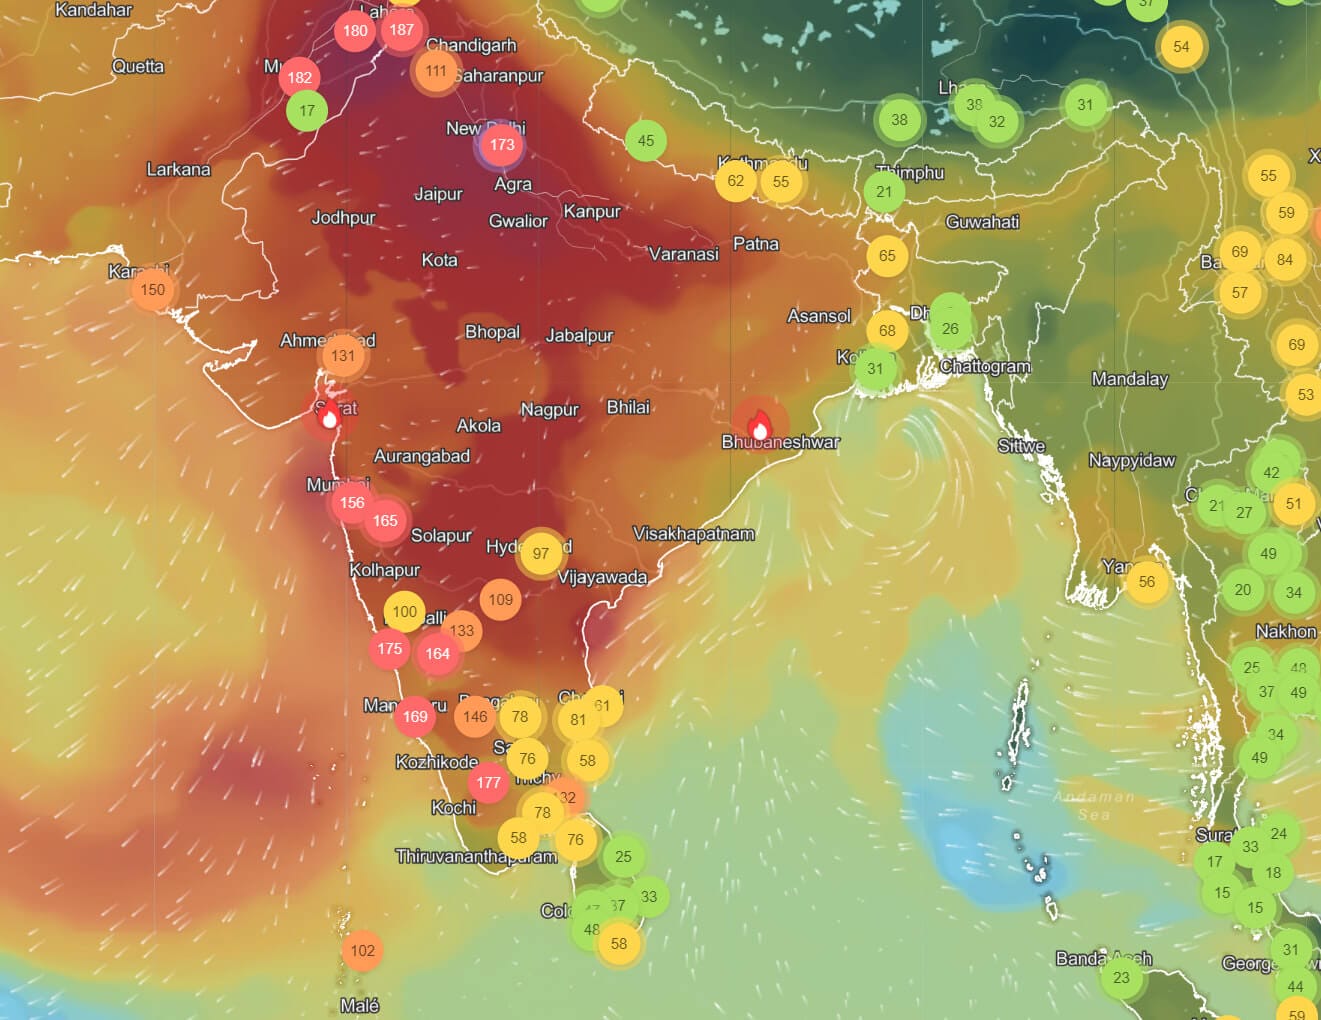
As you can see, the whole Indian peninsula is shrouded in orange, red, purple and maroon. While there are apparent differences in the severity of air pollution depending on the region, only the Far East of India has areas with good air quality. This shows that poor air quality is an issue plaguing the entire country.
It’s important to note two things from this map. Firstly, this image was taken as I wrote this article – it’s not an example of air quality in India on a bad day. Instead, it’s an image of the air quality in India on a typical day – In fact, New Delhi hasn’t seen a single day with ‘good’ or even ‘moderate’ air quality this month. Secondly, while metropolises such as New Delhi and Mumbai might see the worst air pollution, it’s an issue that exists country-wide and impacts everyone in India.
However, while these numbers and colours are telling, they don’t explain the severity of the issue. While we all associate red with bad and green with good, the colours alone are hard to put meaning to unless you know how much air pollution impacts anyone living in India.
Before discussing some stats about how air pollution affects people in India, though, I want to recommend this article on the impacts of air pollution. Since this article primarily addresses the issue in India, I won’t be taking more than a quick look at the dangers of air pollution, so please feel free to refer to that article for more information on its impacts. With that said, let’s see how air pollution impacts those living in India.
Air pollution in India causes:
- In 2022, six of the world’s top ten most polluted cities were located in India. A further two were found in neighbouring Pakistan.
- At a minimum, around 600,000 deaths per year. The WHO reports this number, but other studies, such as one released by the Lancet, estimate it to be much higher, at 1.6 million deaths in 2019.
- Almost 18% of all deaths in India are attributed to air pollution. However, since air pollution can impact every organ in the human body, the number and percentage are likely higher.
- Air Pollution in India reduces locals’ life expectancy by up to nine years.
- Air pollution accounted for just under $37 billion of economic loss in India in one year alone.
These stats are only scratching the surface of the issue, but I feel they go a long way towards highlighting the severity of the air pollution issue in India. While it’s easy to see the NAQI number on any given day, relating consequences to these numbers makes the seriousness of the problem instantly apparent.
Unfortunately, while these stats are severe, they aren’t necessarily the worst effects of air pollution. Even if the air pollution levels are addressed now, future generations will continue to feel the consequences of poor air quality. If this issue isn’t solved quickly, these issues will only be exacerbated.
Air pollution can impact pregnant women and children, hindering and preventing the development of organs such as the brain. It’s been shown that air pollution decreases cognitive performance in the short term and can even slow brain development and reduce IQ.
Unfortunately, this is only one danger of air pollution, and it can also impact the lungs and other organs, causing asthma, heart conditions, and even diabetes. Since children are particularly active, they also breathe in higher levels of air pollution, exacerbating any effects they may have.
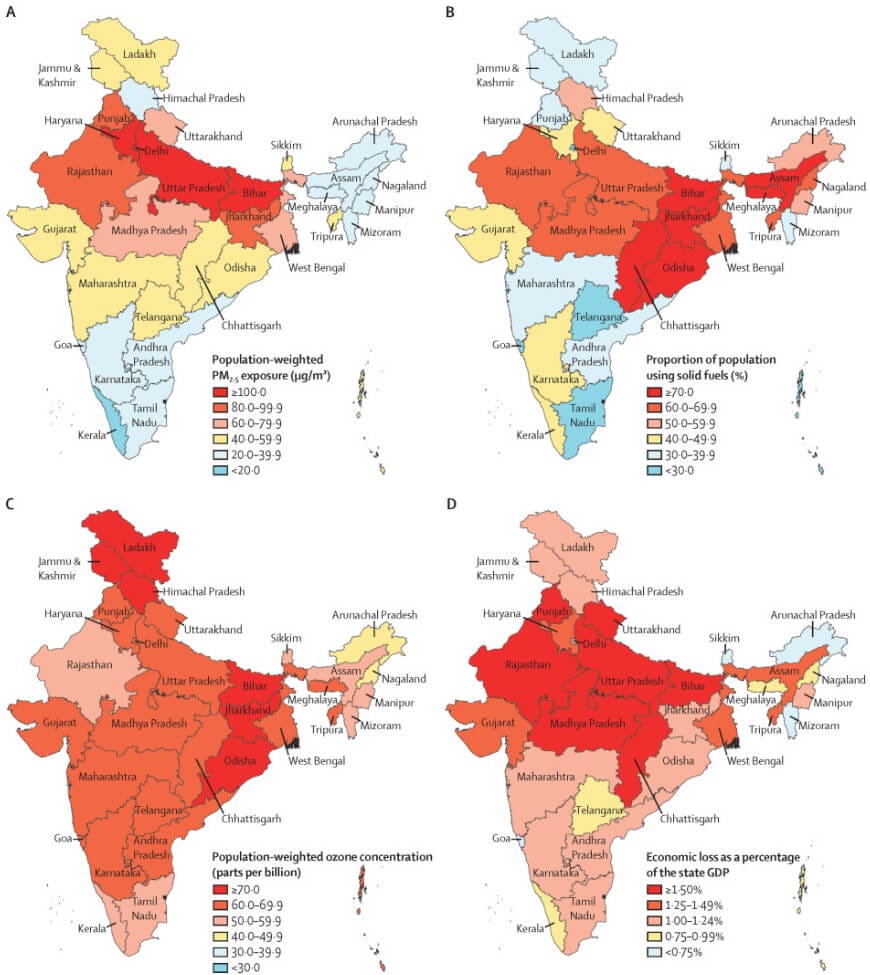
While I don’t believe it is as pertinent because I believe the human cost of air pollution is why we need to focus on improving air quality, there is also a significant economic impact in India due to air pollution. The Lancet graph above shows the economic loss as a percentage of GDP, and it can be seen that in many northern states, the economic loss is greater than 1.5%. Overall, air pollution led to an economic loss of $37 billion over one year, which will likely increase.
No matter how you look at it, air pollution is a grave issue in India. While it’s a complex issue to solve, due to its multifaceted nature, actions must be taken, and national and regional governments must take steps to improve air quality in India.
What Causes Air Pollution in India?
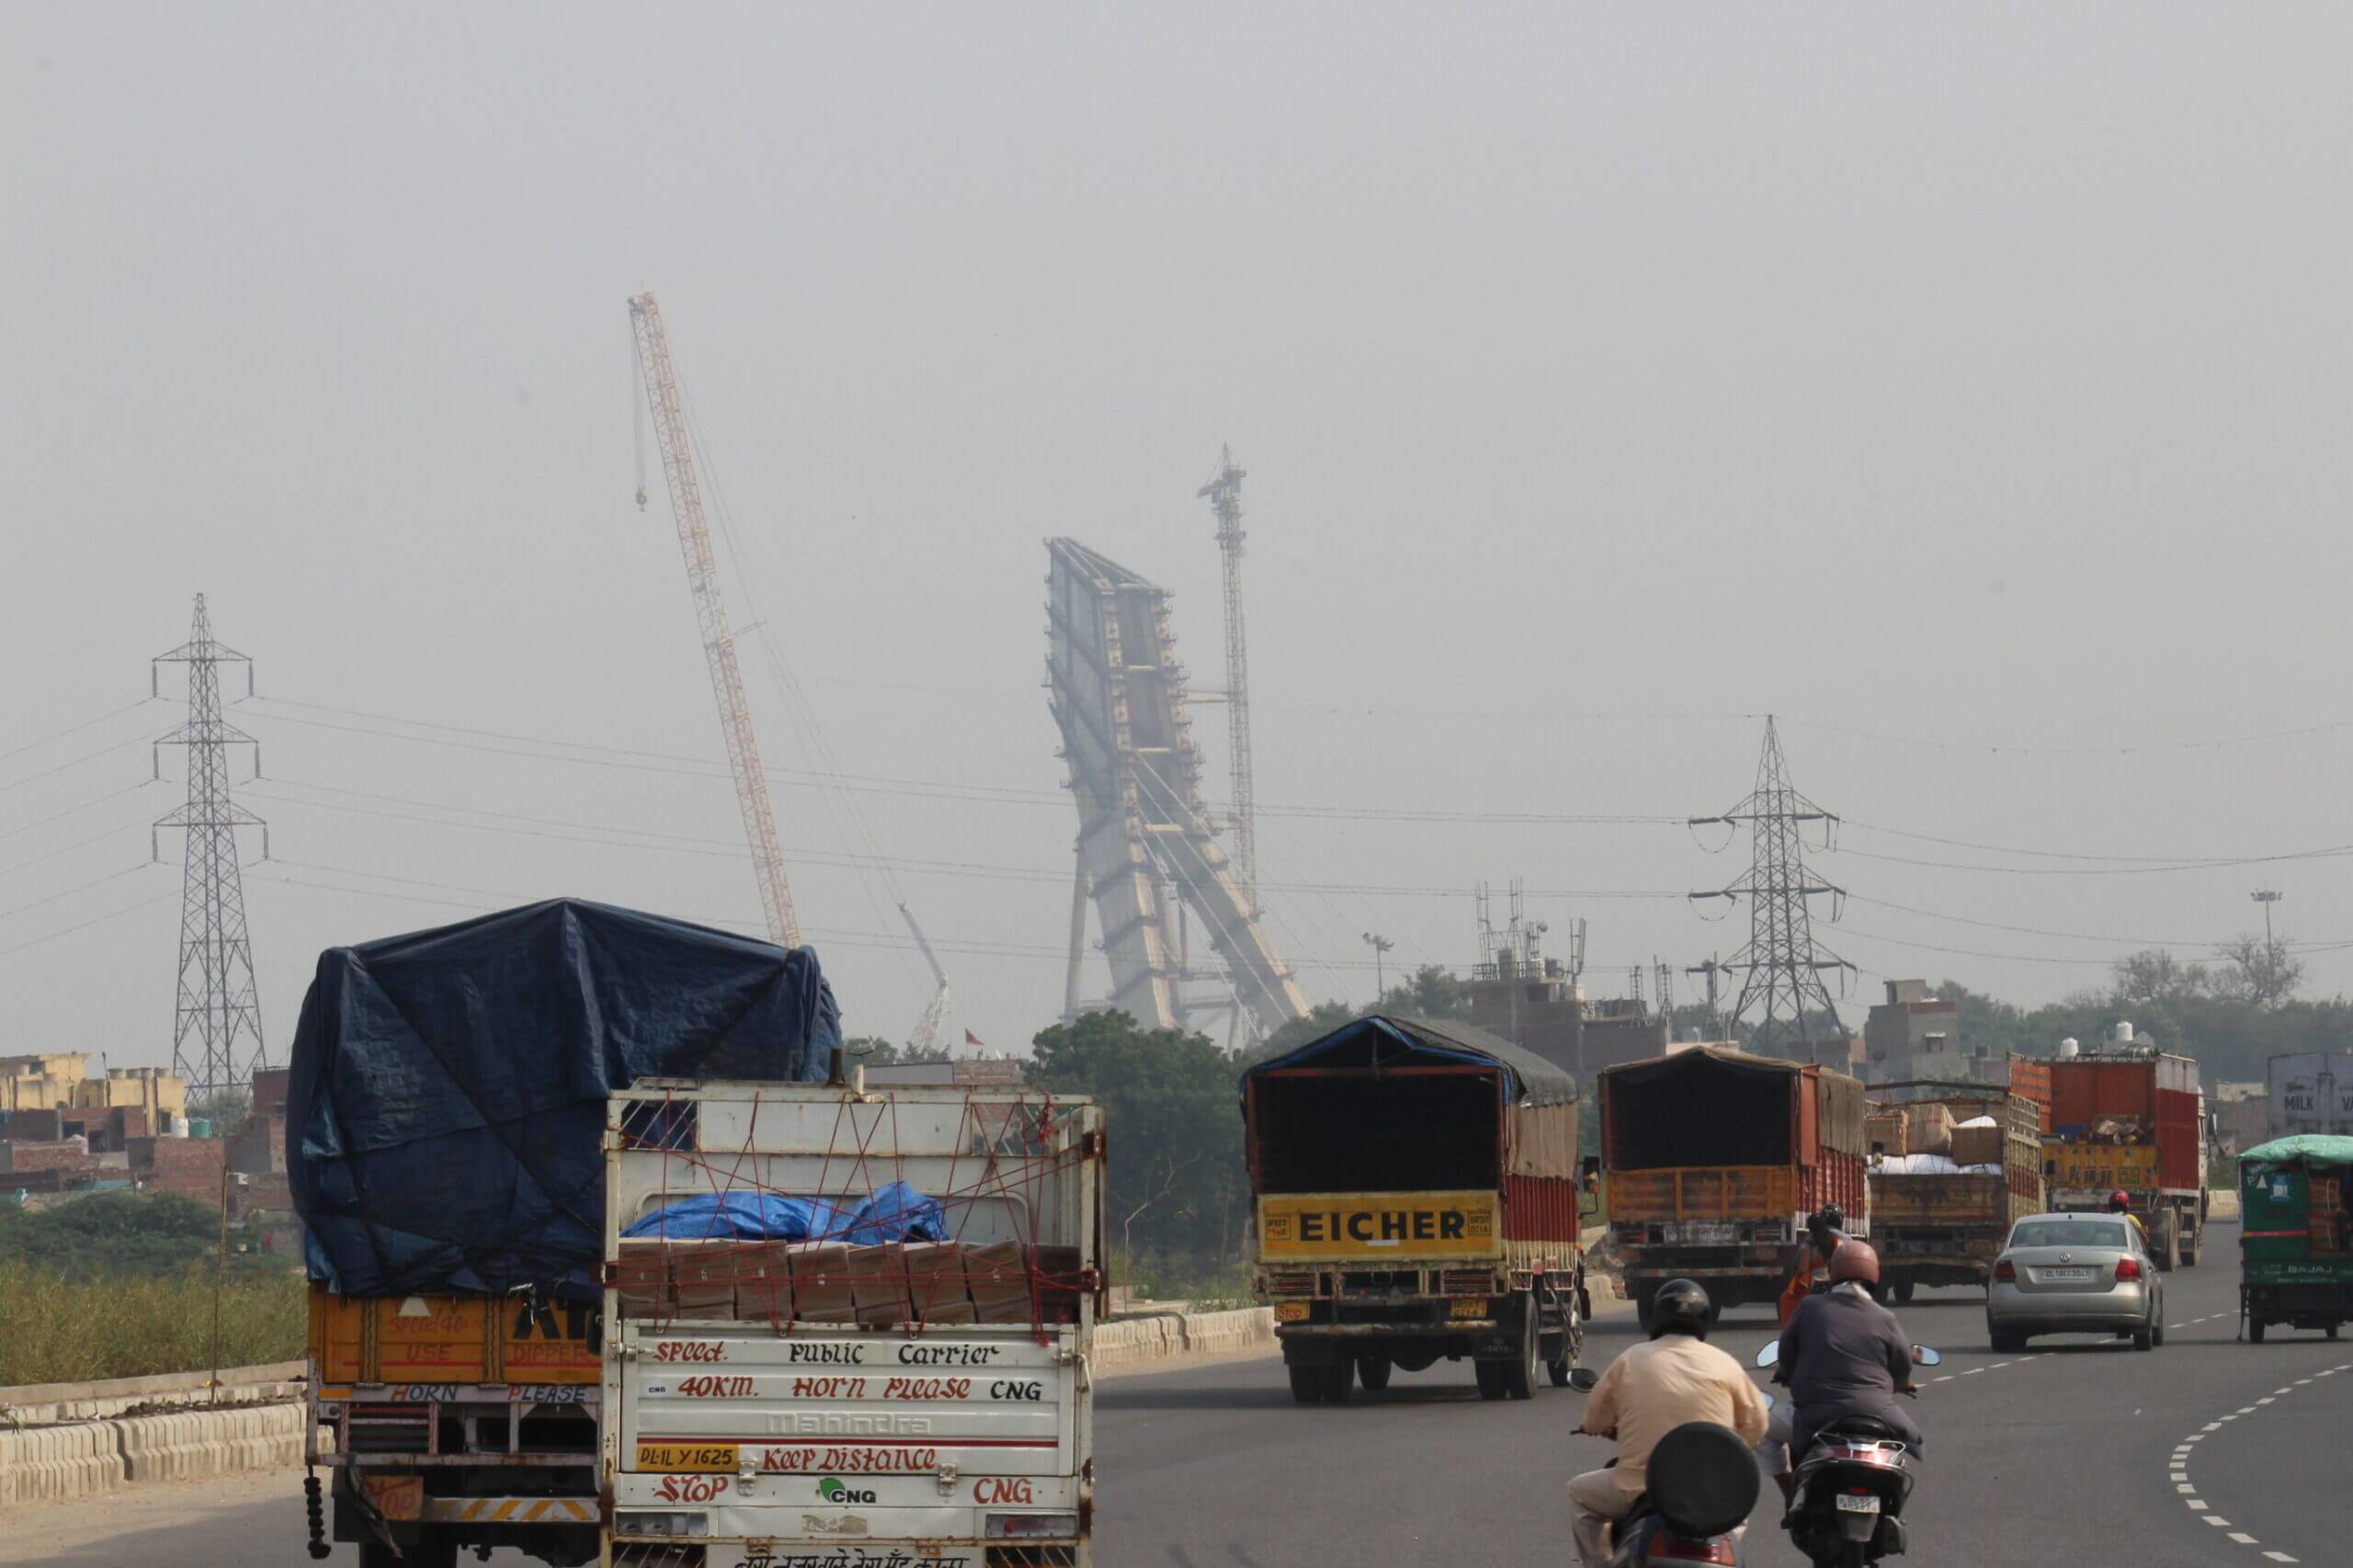
Now that we know there is an air pollution issue in India, it’s time to look at the cause of the problem. Before discussing that, though, it’s worth noting that India’s most prominent pollutants are PM2.5 and PM10. While other pollutants, such as NO2, CO, and Ozone, regularly exceed standards, fine particles such as PM2.5 and PM10 exceed the standards the most and are, therefore, the cause of most concern.
India is a large country, and each source of air pollution contributes differently in each area. That said, the sources are similar country-wide and are already well-known due to multiple studies investigating the issue. One such study, which was carried out in New Delhi, identified the primary sources of air pollution in the capital as:
- Vehicle emissions
- Road dust
- Construction dust
- Cooking and heating
- Open waste burning
- Industrial emissions
While many of these factors might make a small impact individually, the sources add up in a city of 25 million and create an almost permanent dust cloud throughout the city.
Interestingly, although we often see New Delhi making headlines due to its severe air pollution, it was found in 2019 that air pollution in Mumbai might have a worse impact on human health due to the higher levels of PM2.5 particles in the air. So, what makes the air pollution in Mumbai so bad?
While the primary sources of air pollution remain the same, the proportions that each source contributes to the overall air quality are different. In Mumbai, road travel accounts for 80% of fossil fuel emissions, and construction dust accounts for 71% of particulate matter. Furthermore, rampant waste burning deteriorates the air quality more.
Air pollution isn’t just an issue in Indian cities, however, as the countryside (especially in the north) also suffers from poor air quality. In these areas, the primary sources of air pollution are agricultural activities such as crop burning. Depending on the winds, particles created by crop burning can impact large areas and even stay airborne for many days. Crop burning is usually seasonal and partially explains why the air quality in October and November is so poor (as discussed soon).

Diwali fireworks are stunning, but they’re also very polluting.
It’s also worth mentioning that festivals such as Diwali significantly impact air pollution. While this event is only once yearly, the day after the fireworks often break records as the air pollution is so severe. In fact, one year, the air pollution levels in New Delhi the day after Diwali were 300 times above the WHO exposure guidelines. Worsening the problem, the monsoon season has concluded by this point, meaning the air pollution often lingers for days or weeks.
Of course, while cities will inherently create air pollution, some environmental factors contribute to the issue. In 2022, the western part of India experienced very poor air quality. This was due to dust storms originating in Pakistan and Afghanistan before blowing over the western regions of India. Unfortunately, the frequency of these dust storms is increasing, likely due to climate change. While more studying and modelling needs to be done, these dust storms will continue to cause serious air pollution issues in western India when they arise.
On top of this, weather patterns and geography can also worsen the air pollution problem. For example, the geography of northern India, especially around the Indo-Gangetic Plain, means that the Himalayas trap pollution as it can pass the mountains. This leads to a buildup of fine and ultrafine particles, which linger for long periods.
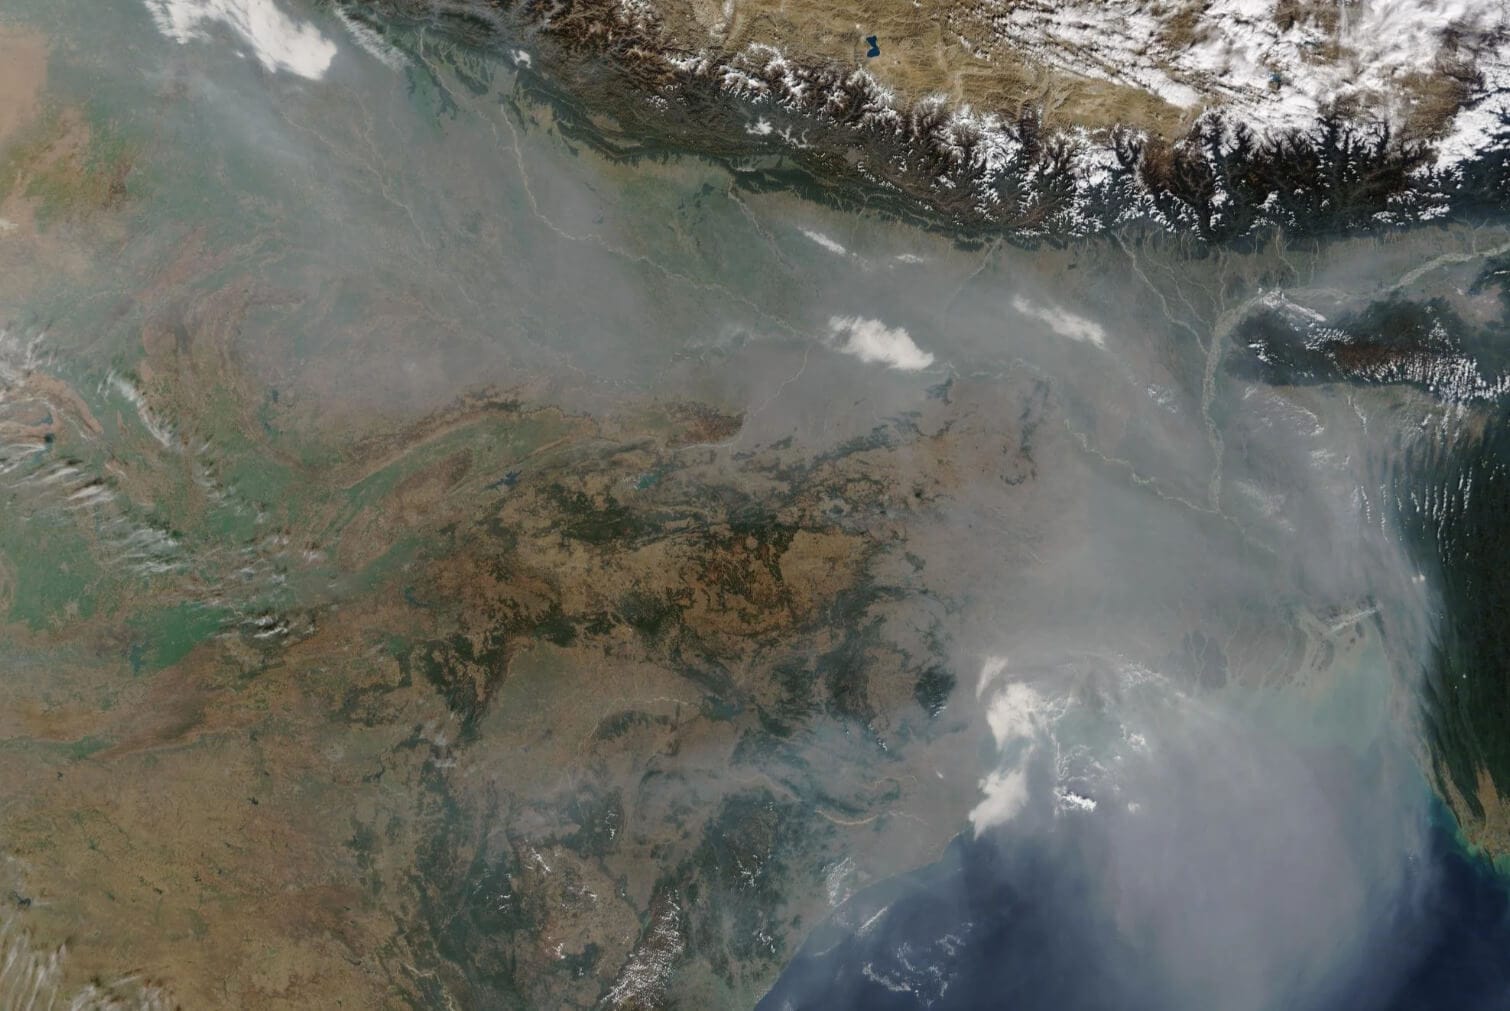
A NASA image of the air pollution over the Indo-Gangetic Plains.
This issue impacts India and neighbouring countries such as Pakistan, Bangladesh, Bhutan and Nepal. The southern part of India doesn’t suffer from this same problem. Instead, it has other environmental issues as air pollution reaches it due to winds which bring dust particles across the Arabian Sea and the Bay of Bengal.
No matter how we approach the issue, it’s clear that air pollution in India is a multifaceted issue. While the majority of air pollution plaguing the larger cities is from vehicle, industrial, and construction emissions, there is no denying that the environment and climate change are also exacerbating the issue. On some days, environmental factors are the primary cause of air pollution!
Seasonality of Air Pollution in India
As with most countries, air pollution levels aren’t consistent year-round. Instead, there are changes in air pollution levels depending on the seasons. While it’s true that India has year-round pollution and that pollution remains consistently bad in most areas regardless of the time of year, there are also times when air pollution becomes more severe in India.
To assume that cities such as New Delhi are always covered in a grey haze would be wrong. However, even during the months when air pollution is at its lowest levels, there are still many ‘moderate’ and ‘poor’ air quality days. So, what months bring the best air quality in India? Well, being such a big country, this can differ between areas. However, there are some overall trends so I will base my statements in this section on those.
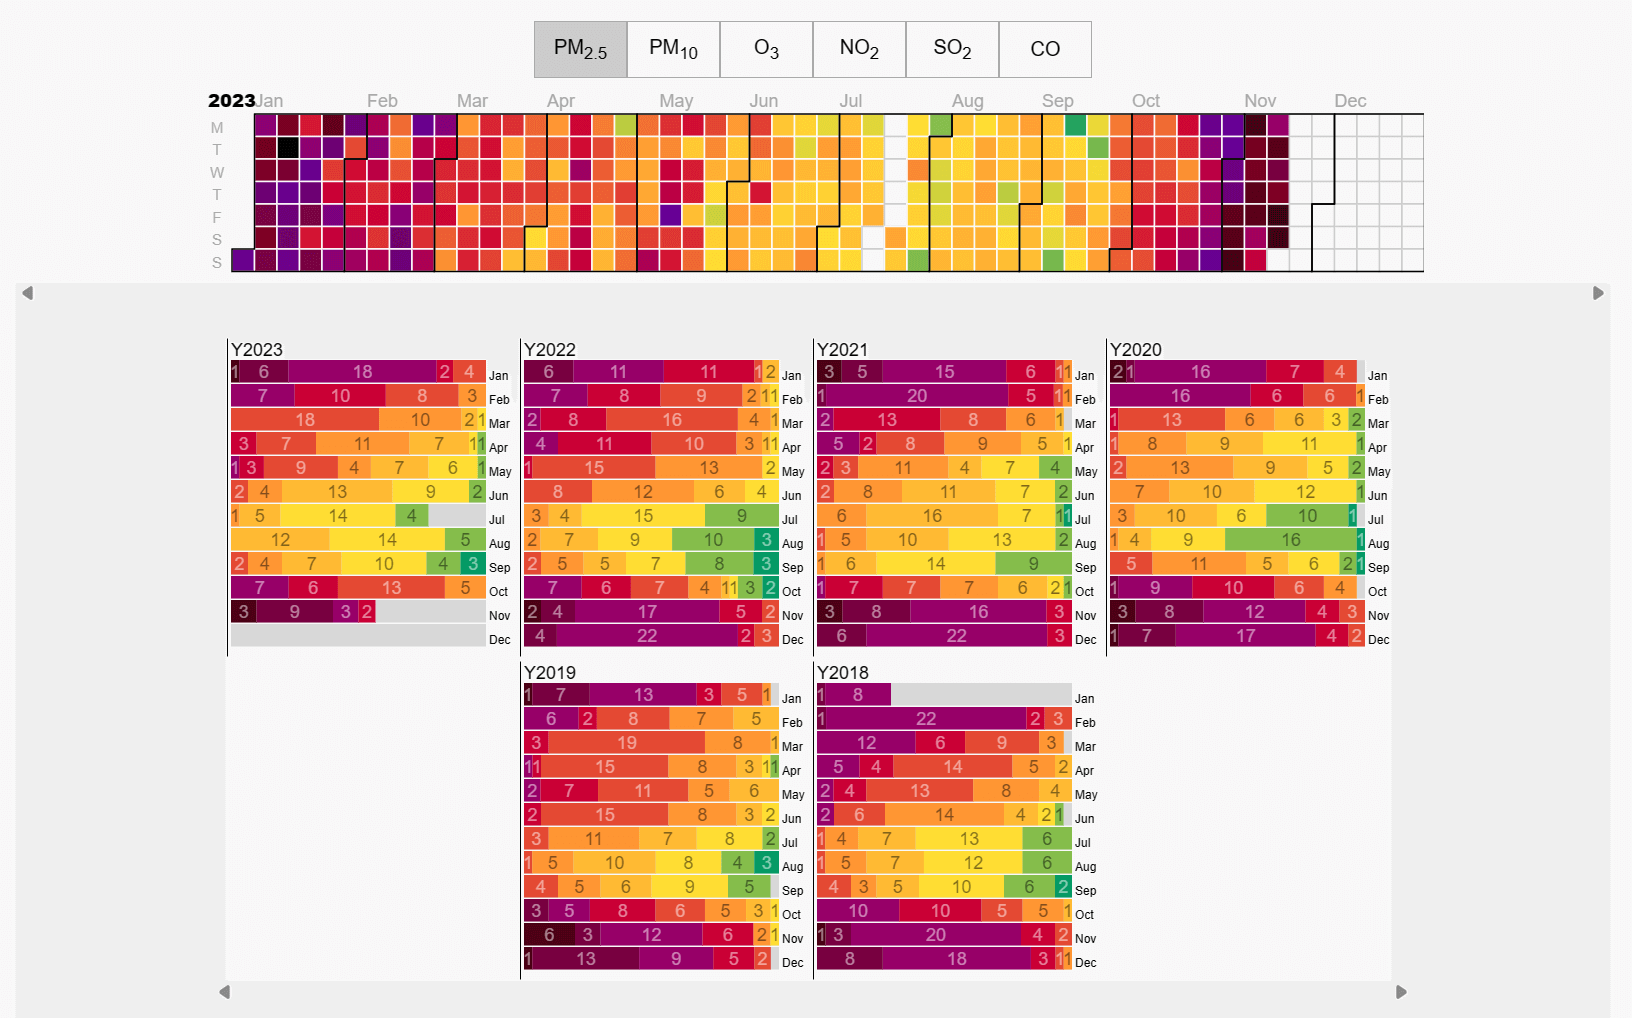
An image of the historic air quality monitor in New Delhi. Image from AQICN.
The above image shows the mean air quality every day since 2018. As you can see, there is a noticeable trend in air quality in New Delhi. Air pollution tends to be at its worst in November, December, January, and February. During these months, most days are purple (using the U.S. EPA AQI), signifying an AQI rating of over 200. There are even quite a few maroon days mixed in during these months.
On the other hand, the air quality is much better during May, June, and July and August. Particularly in July and August, we begin to see quite a few ‘good’ or ‘moderate’ days as per the EPA AQI scale. While the good air quality days are mostly consolidated to these months, there is a noticeable difference in air pollution in India depending on the month.
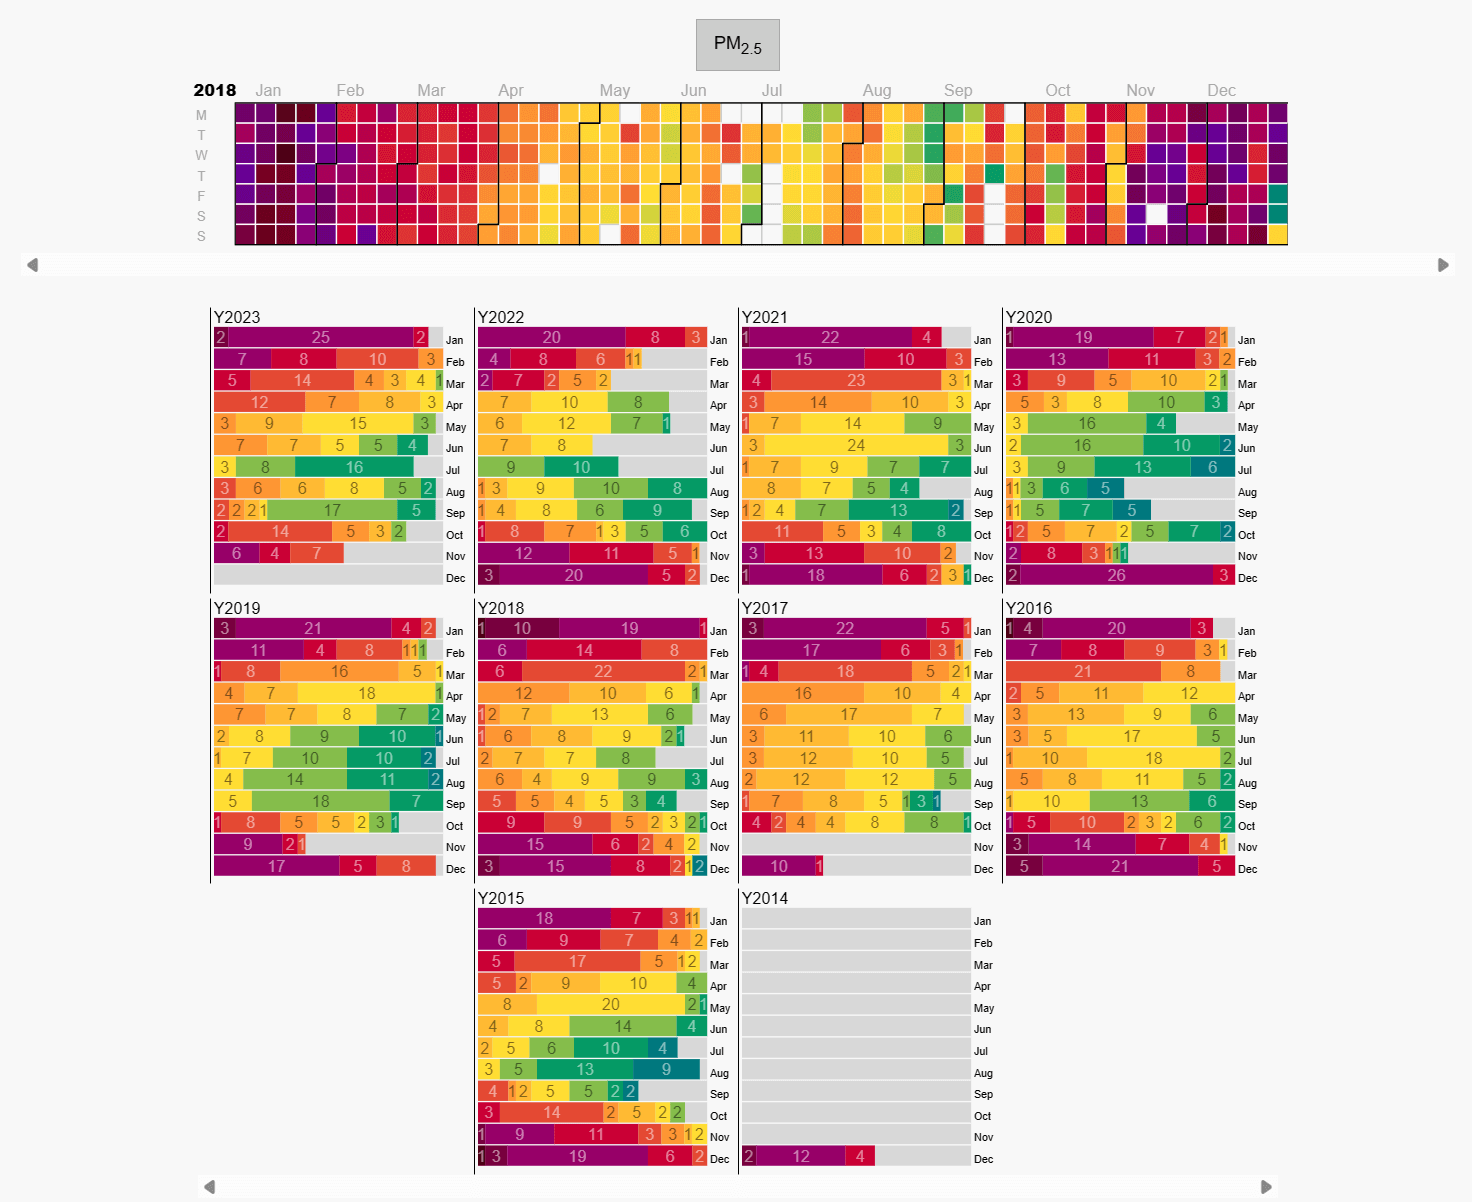
Above is another chart from AQICN. However, this time, the image shows the air quality in Kolkata over the past ten years. As you can see, while there are more ‘good’ air quality days, there are still pronounced seasons. During the summer, air quality improves; in some years, the June-August season doesn’t see any days with anything worse than ‘moderate’ air quality!
While it’s easy to get caught up in the media, these graphs dispel the view that India is a country that has grey smog over it every day. While it’s true that India has some of the worst air pollution in the world, it’s essential to realise that there are seasons to the pollution and that it does relent somewhat in the summer months.
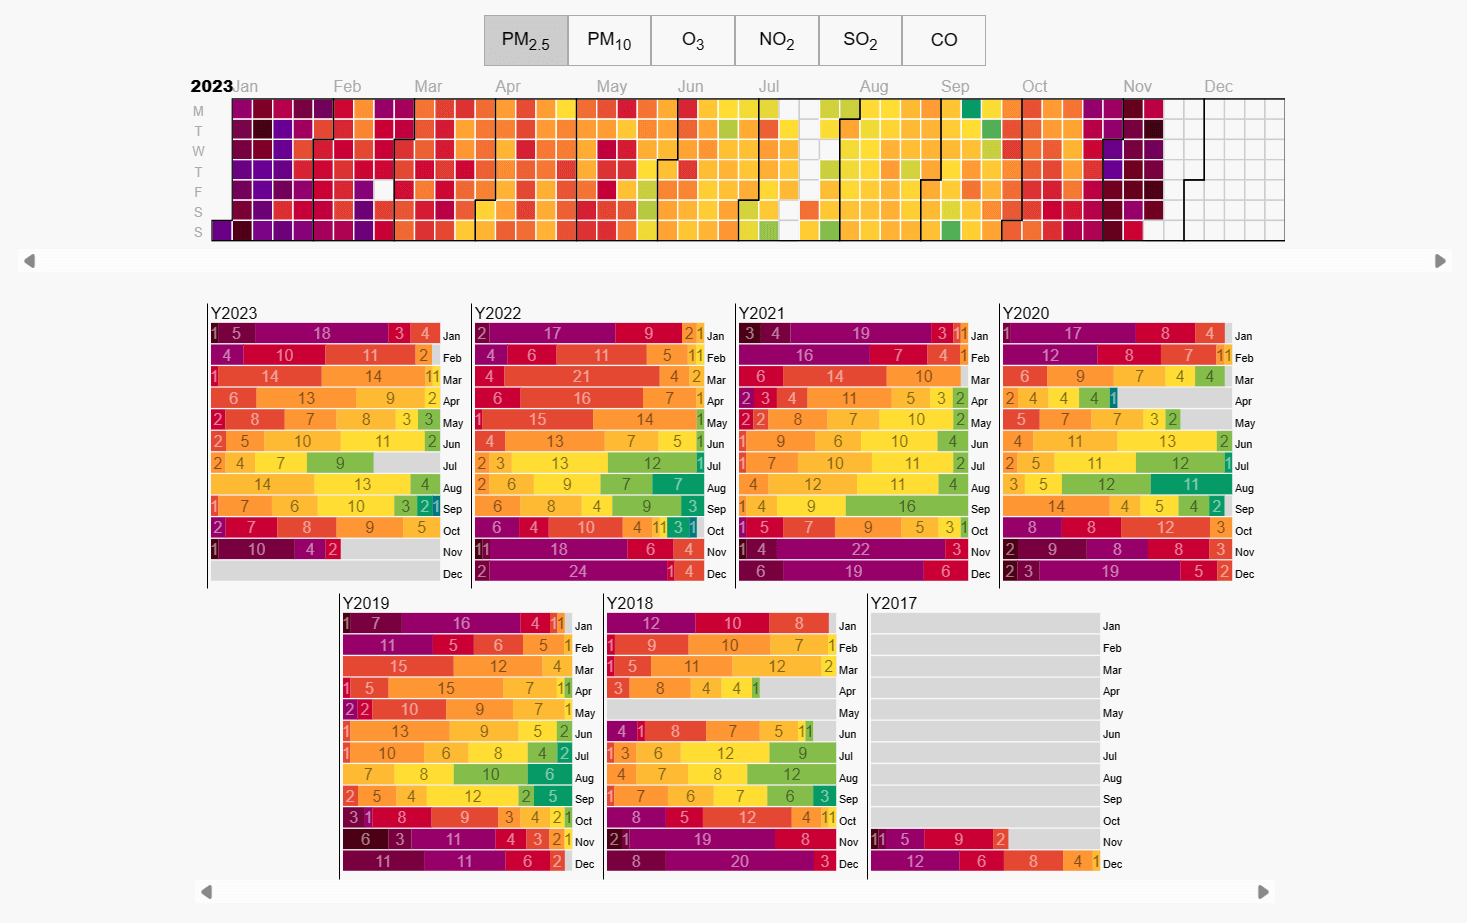
This is the graph I imagine you might have been looking for! Above is the AQICN chart for New Delhi since 2017. Despite being known for its air pollution, even New Delhi has seasonality regarding the issue. While there is no doubt that the air pollution issue needs to be solved, there are some respites during April – September, with the best months being July and August – similar to the other cities we looked at.
So, what causes this difference in air quality throughout the year? Well, it’s down to a few factors. Firstly, it’s important to note that all large cities will always have some air pollution. Vehicle emissions, industrial emissions, and burning fires see to this. However, other variables can impact air pollution – both in positive and negative ways.
During the best months of the year (June – September), Monsoon Season sweeps over the country, causing heavy rains that catch airborne particles and bring them to the ground. The ample rain during this season means that the skies, which are often polluted, are cleaned after every passing shower. During summer, there is also less fire burning, meaning less smoke in the air.
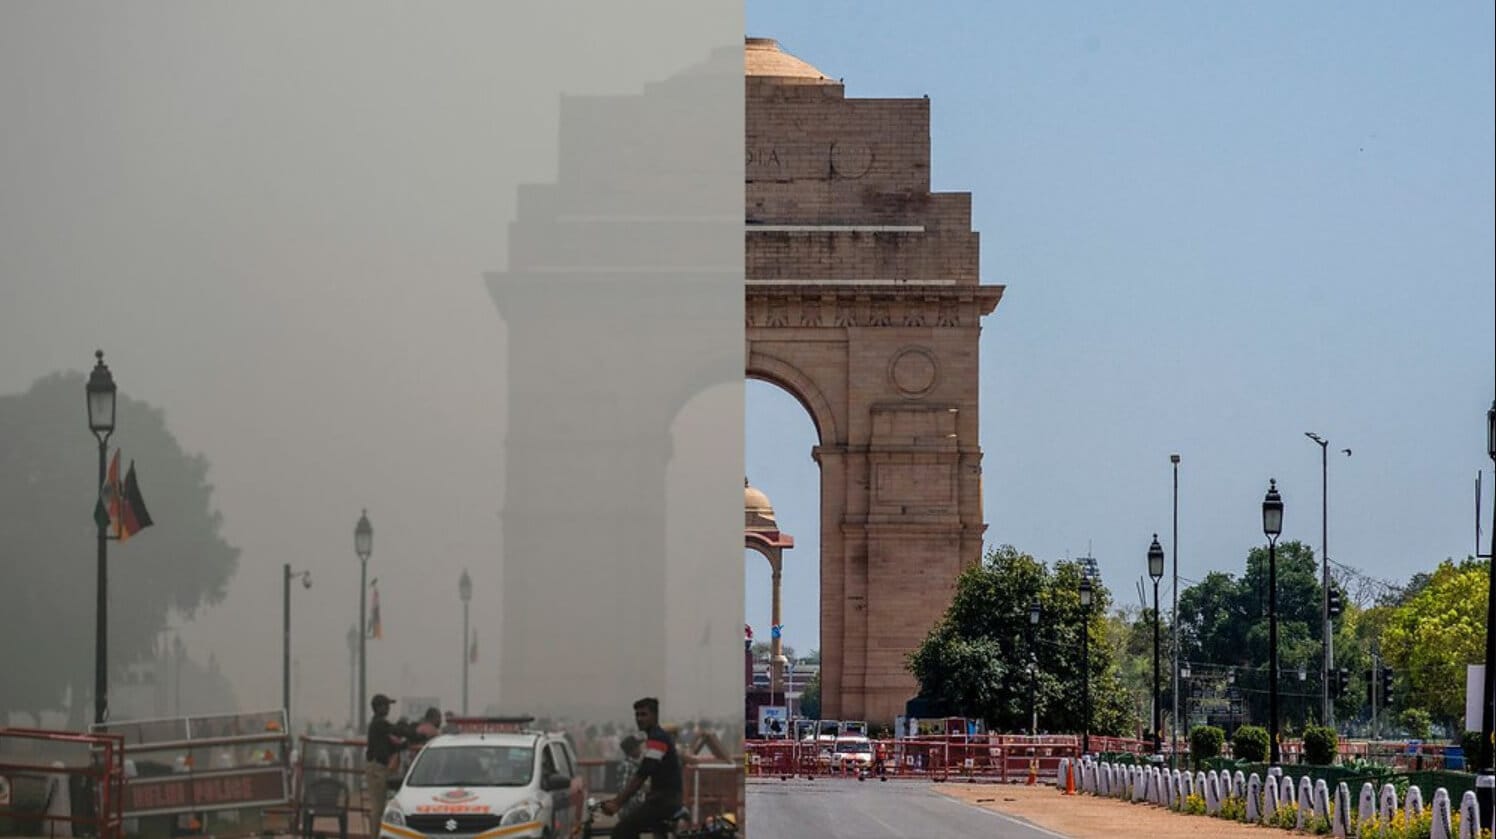
A polluted day compared to a clean-air day in New Delhi. This dispels the belief that Indian cities are always covered in a haze. Image source unknown.
At the end of this season, around September, crop burning usually begins. While burning crops is the easiest and quickest way to clear fields for new crops, it also generates a substantial amount of air pollution, which is a large contributor to poor air pollution during the last months of the year. During this season, there can also be forest fires, which lead to even worse air quality.
Since the temperature also drops significantly during these months, the poor air quality from November to February can be partly attributed to cooking and heating fires. While these might seem like they would have relatively little impact in the long run, a single wood burner has been found to have a big impact on local air pollution, and an open-air fire would likely have an even bigger impact.
Before concluding this section on seasonality, it’s also important to note that environmental factors can contribute to air pollution. For example, one study found that El Niño and the Antarctic Oscillation can impact the poor air quality in India during late fall and winter. There is also the unique geography to consider – especially around New Delhi, where the Himalayas stop air from passing and cause aerosols to gather and linger.
If you are planning a visit to India and looking to avoid air pollution, it might be worth visiting during summer. However, during these months, you will also experience Monsoon season, so it depends on what is more important to you. The key takeaway is that even in India, air pollution is seasonal. While air pollution is relatively bad year-round, there are better and worse seasons and months.
Health Effects of Air Pollution in India
Air pollution is a severe issue, and it’s now one of the leading causes of death worldwide. Nowhere is the impact of air pollution more apparent than in India. Air pollution is dangerous because it impacts every organ and every cell in the human body. When exposed to air pollution, every part of our body is impacted differently.
While we are still uncovering new effects of air pollution on human health every day, we now have enough research to know that air pollution is a silent killer and that it impacts everyone. Many cities in India regularly have fine dust particles 10x or more the ‘safe’ limit set by the WHO, and cities such as New Delhi have been seen as much as 300x over the limit. So, how does this impact the health of those living in affected areas?
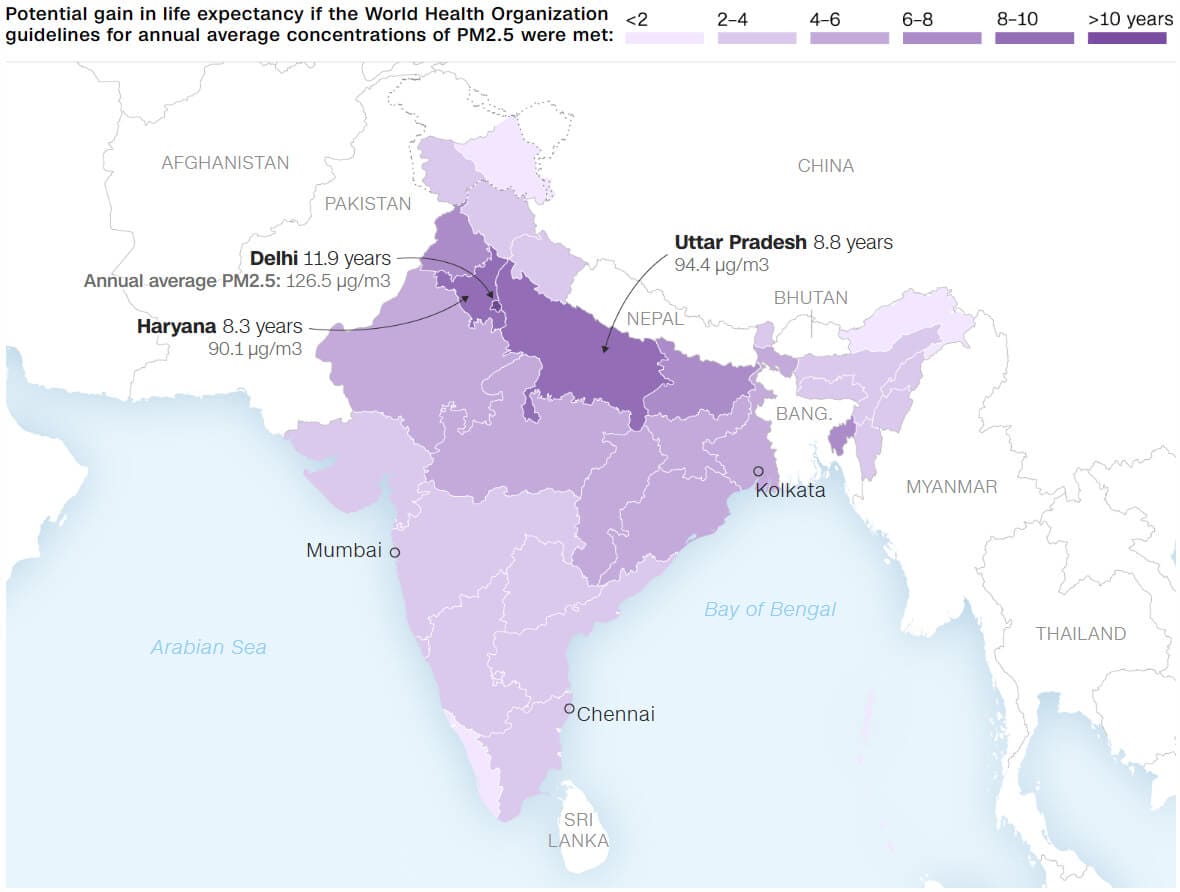
This map, from CNN, shows the potential gain in life expectancy if WHO guidelines for annual average concentrations of PM2.5 were met. As you can see, air pollution has an astounding impact on many areas of India, and life expectancy is reduced by almost 12 years in Delhi. This is an almost unbelievable fact.
While those living in Delhi have the most significant decrease in life expectancy, all of India is impacted. Besides Kerala on the southwestern tip of India and Arunachal Pradesh in the northeast, every state of India could see a more than 2-year gain in life expectancy if WHO guidelines were met.
I wanted to show this map first because it visualises just how severe the air pollution issue in India is. However, it’s important to remember that this isn’t just a map – over a billion people in India alone feel the consequences of air pollution daily.
While the drop in life expectancy is perhaps the most stark example of how air pollution in India affects the health of locals, there are also many other impacts that it can have. This article by The Guardian does a great job of explaining why air pollution is so harmful.
In short, air pollution damages every part of the human body. It can lead to heart and lung diseases, as well as diabetes and dementia. It can even cause brittle bones and damaged skin. Perhaps worse, air pollution can impact fertility, fetuses, and children, meaning that the consequences of air pollution now are likely to be felt for decades into the future.
However, air pollution is even more dangerous than that as it has a range of mental consequences, too – many of which aren’t even considered. Air pollution has been linked to depression and even suicide. On top of this, it can impact cognitive ability and slow reaction times.
Another worrying fact is that air pollution, particularly fine dust, can exacerbate other potential health issues. One relevant example currently is how air pollution can increase the COVID-19 death rate, as it’s been found that an increase of one microgram per cubic metre of PM2.5 increases the COVID-19 death rate by 8%. Now, consider that the PM2.5 concentrations in a city such as Mumbai regularly exceed 100µg/m3, and you suddenly have an 800% higher death rate due to COVID-19.
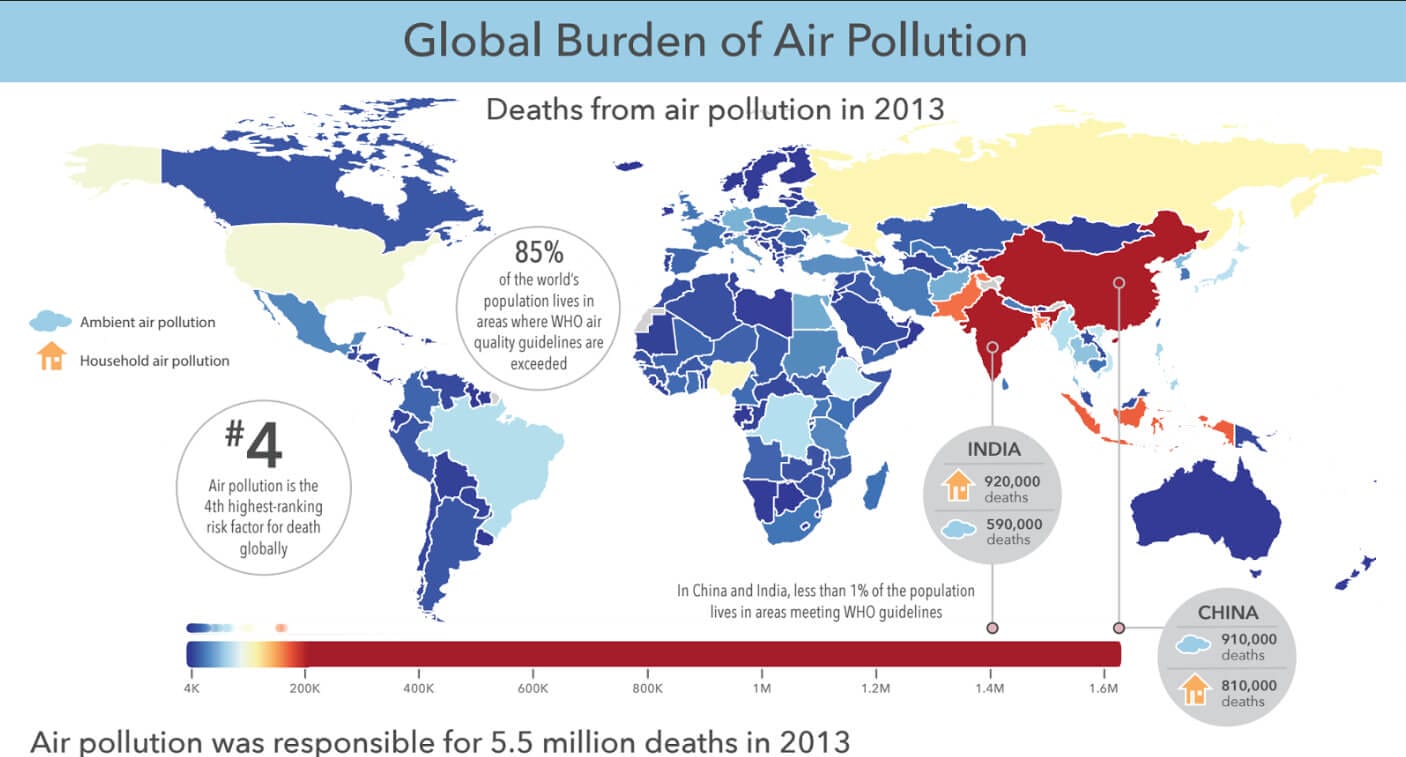
Perhaps the best way to explain how severe the impacts of Air Pollution in India are, however, is to discuss the findings from a Lancet study, which found that air pollution in India led to 1.6 million deaths in 2019 alone. In reality, this number is likely even higher as air pollution can indirectly lead to or increase the severity of other conditions, too.
One of the most upsetting realities of air pollution is that it doesn’t impact everyone equally. The less privileged are almost always impacted more by air pollution, and this New York Times article visualizes this difference in a heartbreaking way. The conclusion is this, though. While the less privileged in India feel more severe impacts of air pollution, even the wealthy can’t escape the dangers of air pollution. While exposures differ, everyone in the country is and will continue to be impacted.
Suffice it to say air pollution in India is a very serious public health concern that needs to be addressed. Unfortunately, while some steps are in place to improve air quality, action is slow and often not strong enough. Some countries and cities, such as Beijing, have shown that air quality can be improved, but work is needed.
Does Location Affect Air Pollution in India?
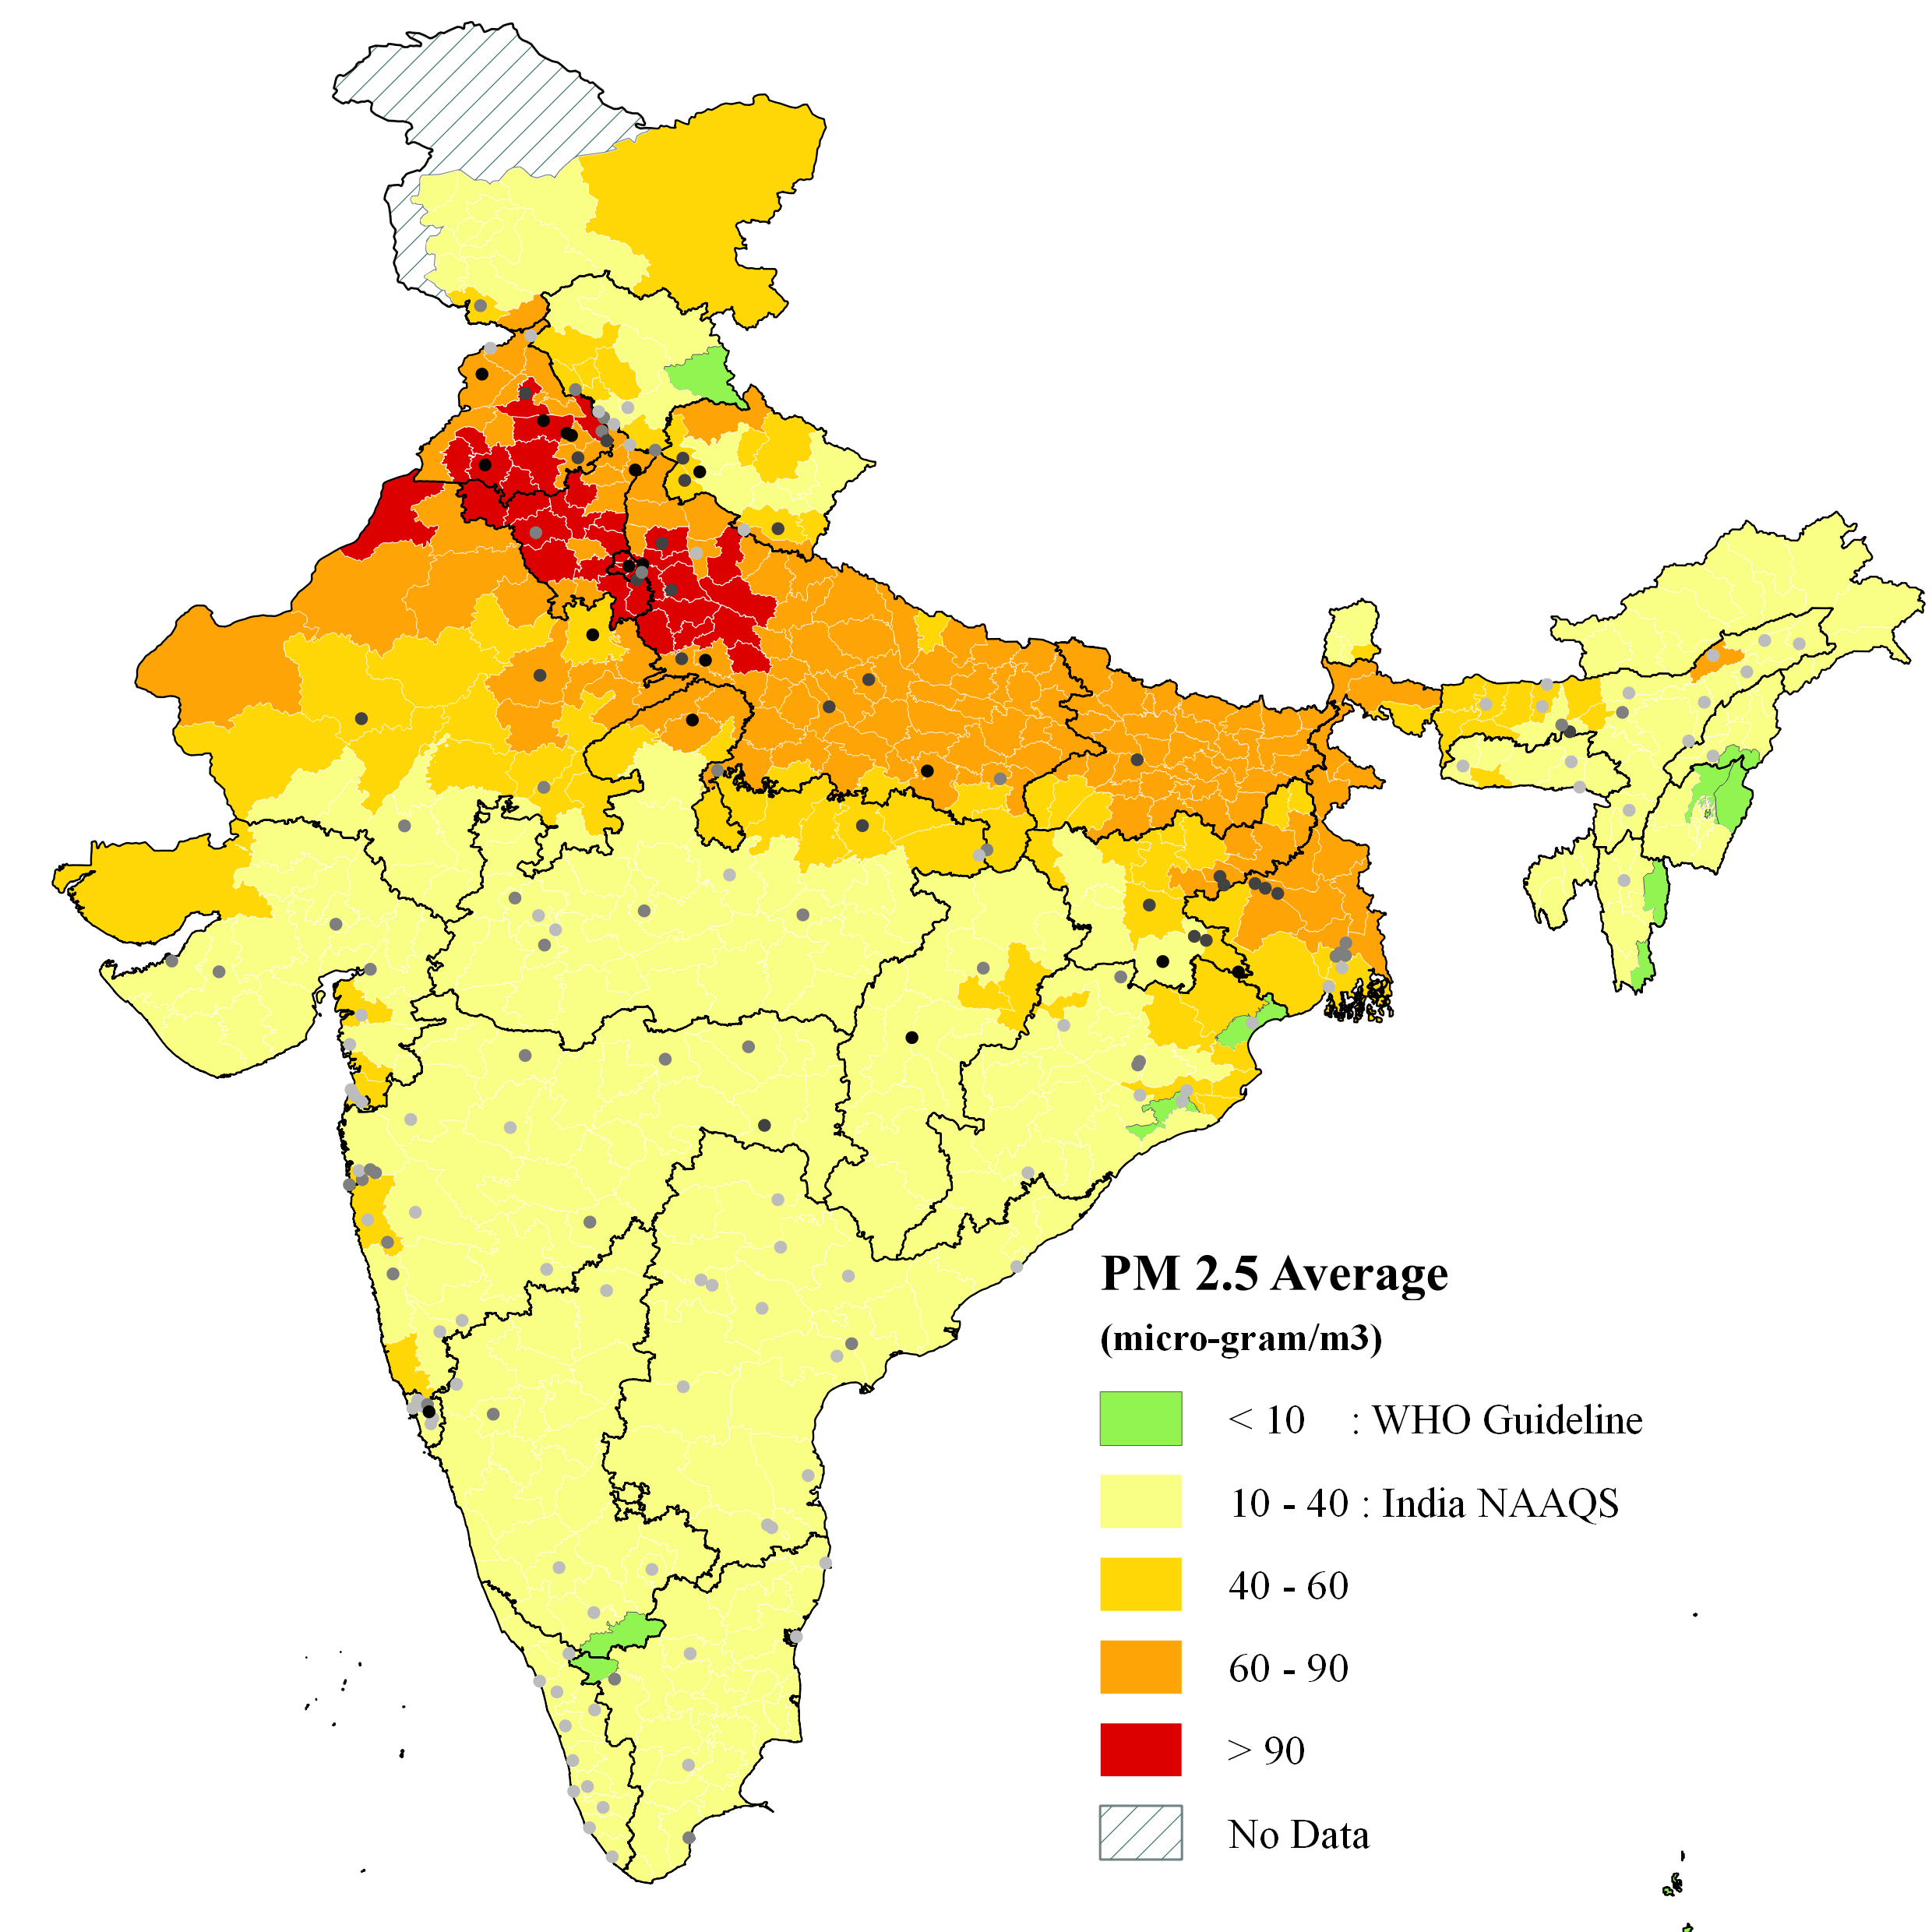
India is a gigantic country, and air pollution levels aren’t a universal issue across the peninsula. That said, about 95% of the country has air pollution that exceeds the WHO guidelines, and many areas surpass this limit many times over. Therefore, we can say that the whole country suffers from air pollution.
However, while air pollution is an issue that impacts the entire country, the PM2.5 concentrations do differ in different cities and regions. The map above shows that the Indo-Gangetic Plain (North Indian River Plain) suffers from the worst air pollution. This is for a few reasons, which we’ve already discussed in this article’s ‘What Causes Air Pollution in India’ section.
As we progress south, the average PM2.5 concentration decreases. However, there are still some outliers. For example, Mumbai on the West Coast suffers from poor air quality (which is often even more harmful than New Delhi’s air pollution). This improvement in air quality is partly due to the lower population in central and southern India (although there are also some large population centres in the south).
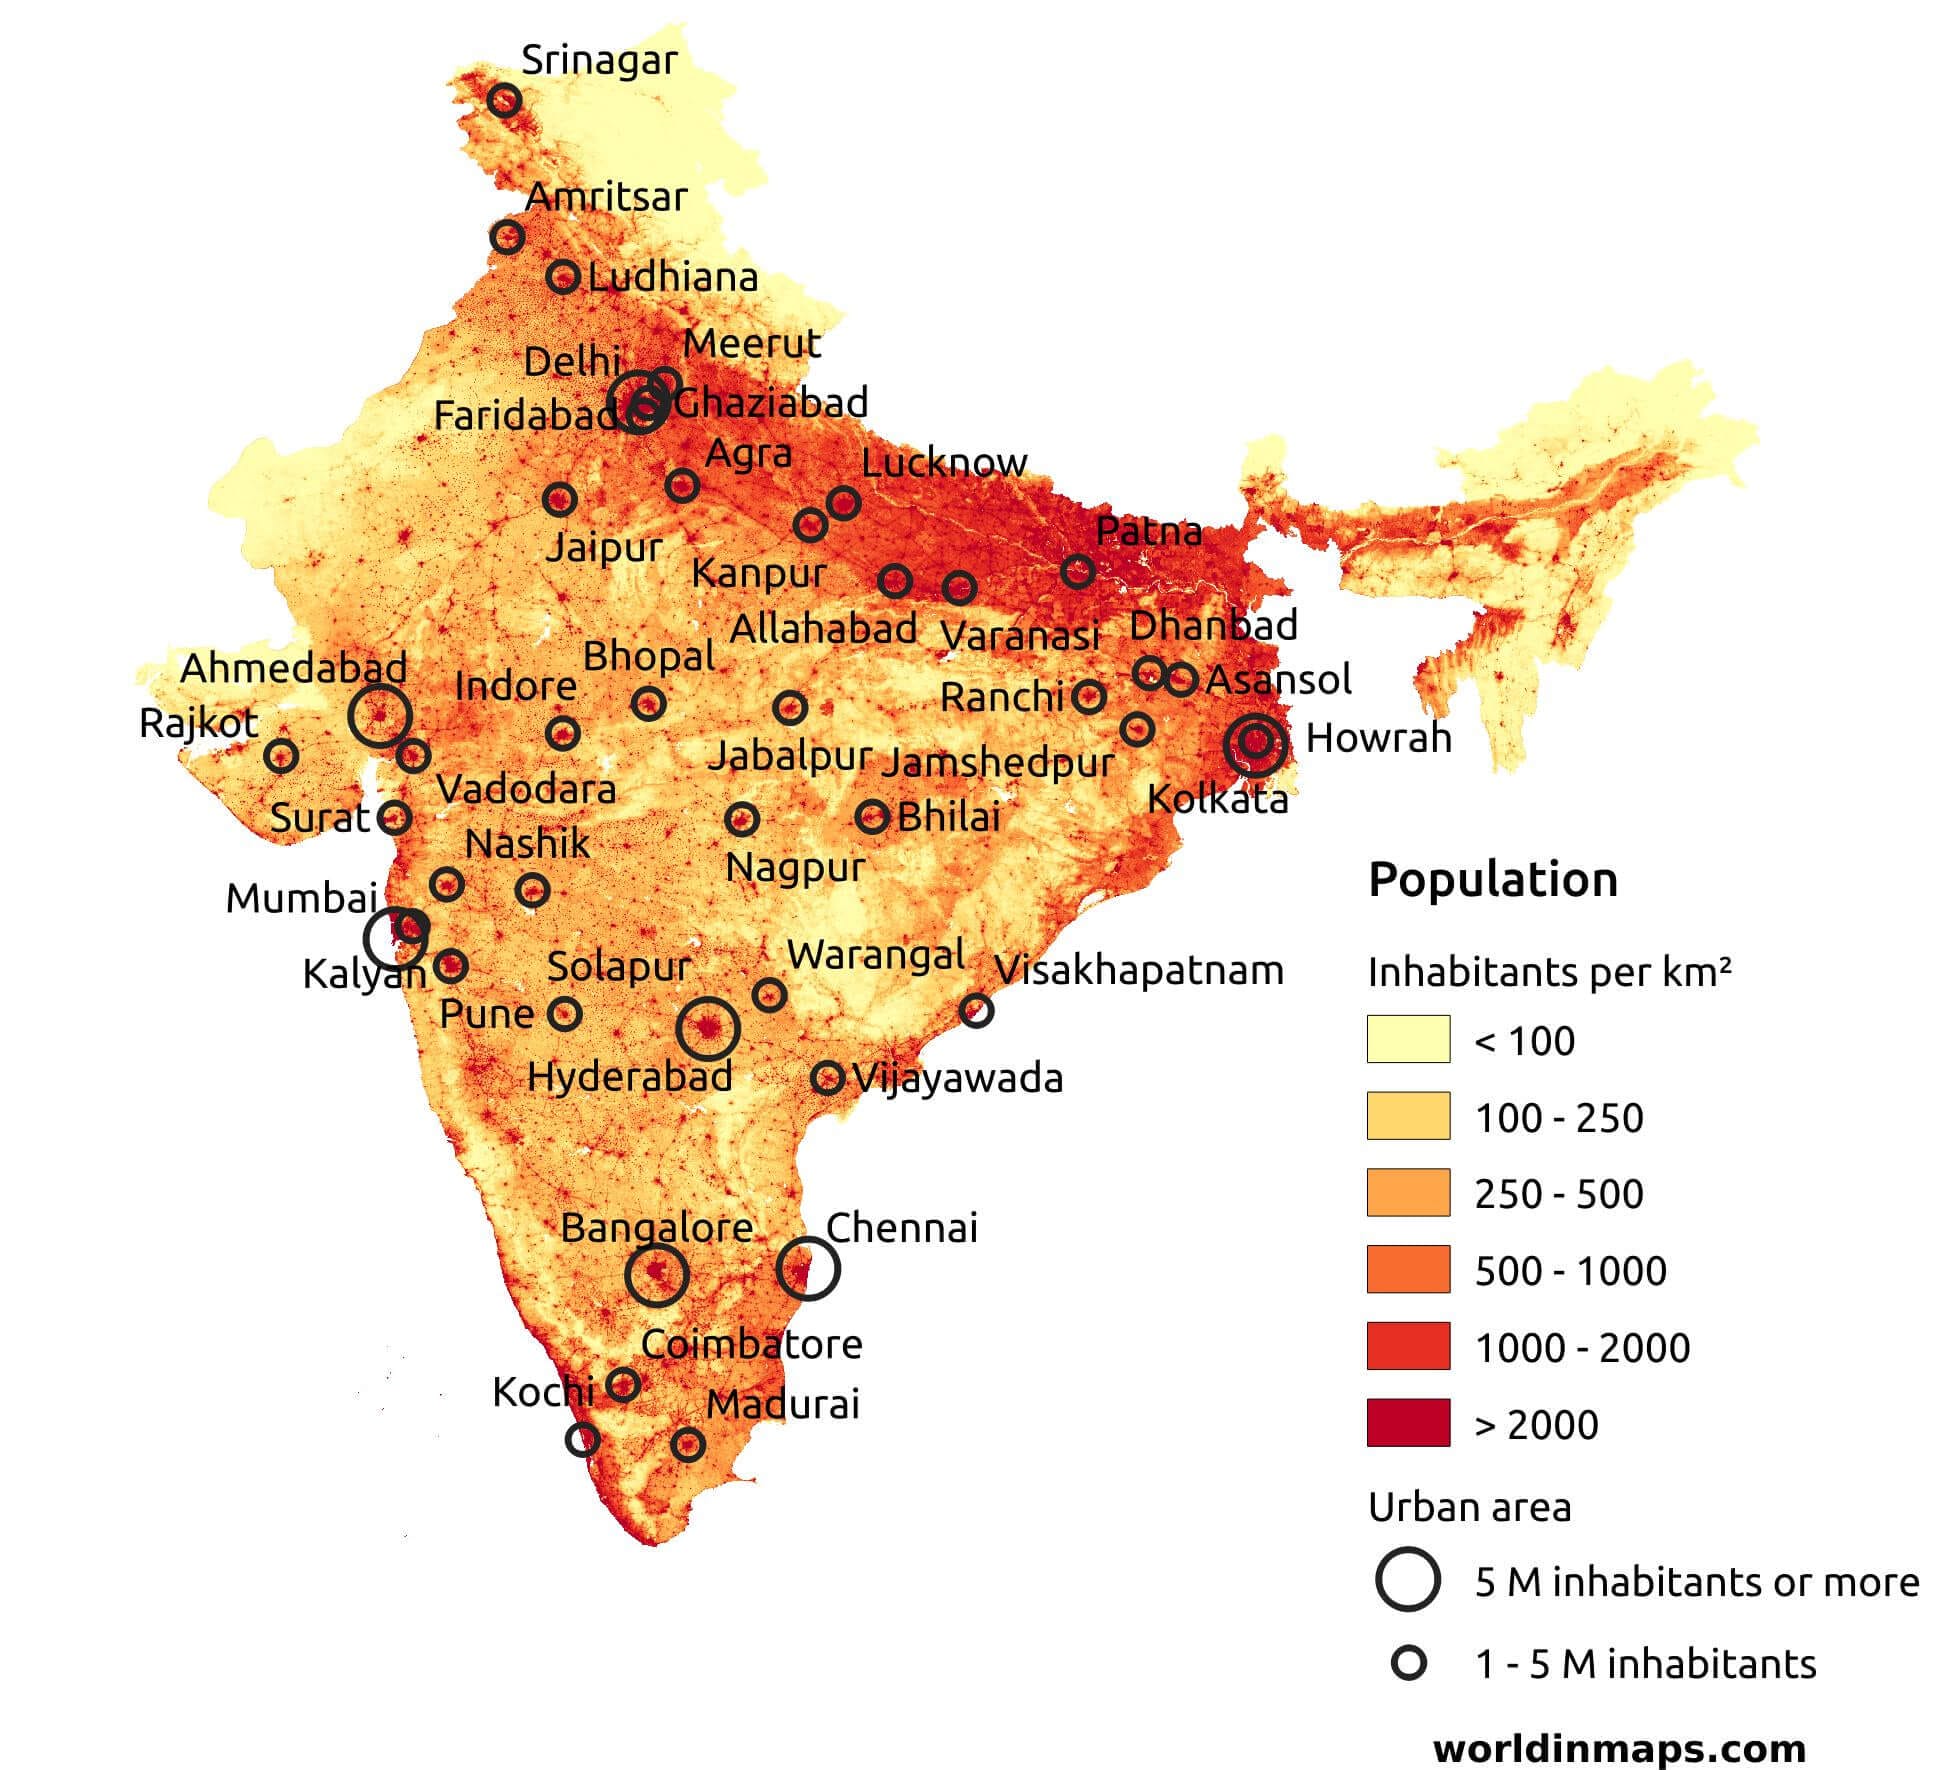
India population map. Source.
The map above shows the population density in India, and it’s clear that the North Indian River Plain houses most of India’s population. Almost one billion people live in this area, generating more air pollution as city sizes increase.
But there are still huge cities such as Bangalore and Chennai in the south, so why do they not suffer from such serious air pollution issues? Well, this is mainly due to better pollution control measures in Southern India and more favourable geography.
While South India is far from perfect, and air pollution is still an issue (especially with pollution hotspots), more measures have been taken to control air pollution there. On top of this, the region also has the geographic advantage of being coastal, which means more and stronger wind, which can blow airborne pollution away. This is opposite to the north, where the mountains prevent air pollution from escaping.
So yes, location does play a role in air quality levels, and some states and cities in India have significantly more severe air pollution than others. However, air pollution is an issue in all states – even the green areas on the map will have days with high concentrations of fine dust.
Understanding AQI in India
NAQI – India’s National Air Quality Index

NAQI – India’s National Air Quality Index scale.
AQI stands for air quality index, and these are the scales we use to measure the current air quality in a given area. If you’re unfamiliar with how the AQI scale works, I recommend reading this article on how AQI works.
However, if you’re already familiar with the traffic-light style scale, you will know that starting at green and moving towards dark maroon or purple, each colour represents worse air quality. What many people don’t realise, though, is that there is no single AQI scale that is used globally.
The U.S. Environmental Protection Agency’s (EPA) scale is the most common AQI scale. While this scale originated from the U.S. EPA, it’s now used in many countries outside the U.S. – especially if you get your air quality information from online platforms such as IQAir or AQICN.
Before discussing the differences in AQI scales, it’s important to remember that an AQI rating is a combination of a range of pollutants, each weighted differently depending on the scale. For example, the U.S EPA scale monitors these pollutants:
- ground-level ozone
- particle pollution (also known as particulate matter, including PM2.5 and PM10)
- carbon monoxide
- sulfur dioxide
- nitrogen dioxide
Therefore, the single number given in an AQI rating is an overall rating that combines and weighs the levels of each pollutant. While it’s out of the scope of this article to discuss the maths behind the EPA scale, there is a technical report that you can read here.
Having different scales has both upsides and downsides. On the one hand, if every country used the same scale, we could directly compare the AQI ratings between different countries without the need for conversions. The downside is that every country has unique air quality conditions, and relying on one AQI scale might not be ideal.
For example, in some areas, most poor air conditions are caused by natural dust (PM2.5 and PM10). In other areas, however, the primary source of pollution may be vehicle emissions (particles and harmful gases). Therefore, different AQI scales allow countries to tailor the scale to their primary pollutants.
India uses a scale called NAQI (National Air Quality Index), which the Central Pollution Control Board created. This index is used locally in India, and if you’re viewing the AQI on a local government website, you are likely seeing the NAQI rating. Alternatively, if you are viewing data on a platform such as AirVisual, you are more than likely seeing the U.S. EPA AQI scale. If unsure, check the FAQ or data sources page for more information.
So, what are the differences between the NAQI and EPA AQI scales? Well, as it turns out, they’re pretty interesting!
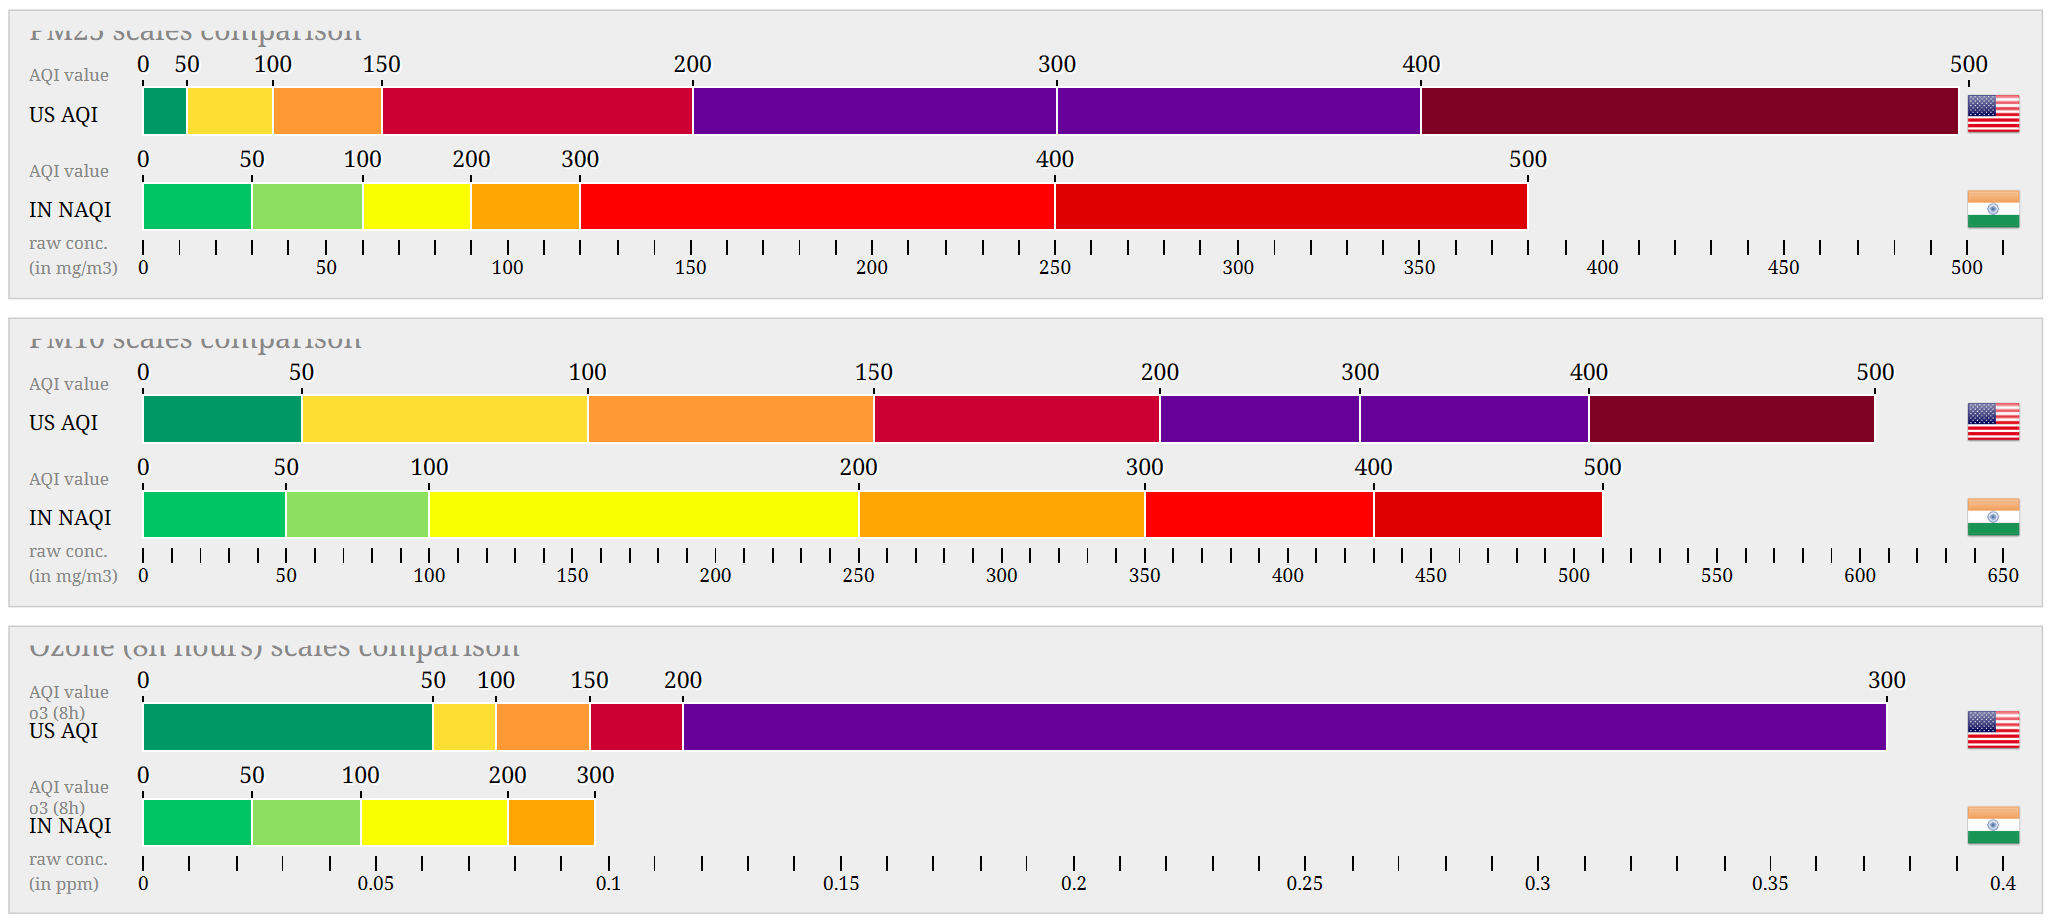
Table from AQICN. From top to bottom: PM2.5 scales comparison, PM10 scales comparison, Ozone scales comparison.
The graph above shows how the scales differ in reporting the concentrations of three pollutants – PM2.5, PM10 and Ozone. Each table shows the U.S. EPA AQI above the Indian NAQI index. We can take away a few interesting points from this comparison.
Firstly, the NAQI uses extra shades of a few colours. Where the U.S. EPA scale uses only one shade for each colour, the NAQI scale adds an extra shade of green and red. It also never uses purple or maroon – both of which the EPA scale uses. If you were glancing at the scales, you might think that since they both show the same shade of red, the air quality is the same. However, on the NAQI scale, dark red can mean anything from 250μg/m3 to 380μg/m3 (where the NAQI scale stops, so really it is 250μg/m3+ of PM2.5) of PM2.5 particles, whereas on the EPA scale, it would only mean 65μg/m3 to 150μg/m3 of PM2.5. This vast difference shows why you can’t directly compare colours or numbers from either scale.
With this in mind, we can say that at lower concentrations, the Indian NAQI scale is much more lenient, allowing far higher concentrations of fine dust (PM2.5 and PM10) at each AQI value. Interestingly, however, the NAQI scale becomes more stringent at very high concentrations. For example, based purely on PM2.5, a rating of 500 on the National Air Quality Index would be only 420 on the EPA index. It’s worth noting that both indexes stop at 500, so in reality, the value could be beyond 500.
Generally speaking, however, regarding fine dust, the NAQI is less strict than the EPA scale. On the other hand, the NAQI scale is far more stringent regarding ozone levels, as 300 on the NAQI scale would be only 150 on the U.S. EPA scale. This shows how much AQI scales can differ and how each is tailored to local conditions.
Until now, we’ve discussed the individual pollutant concentrations and their thresholds in each air quality index. However, when viewing the air quality on an app or website, many prefer to refer to the colour and its attached meaning. To confuse everyone, there are also differences between the two scales!
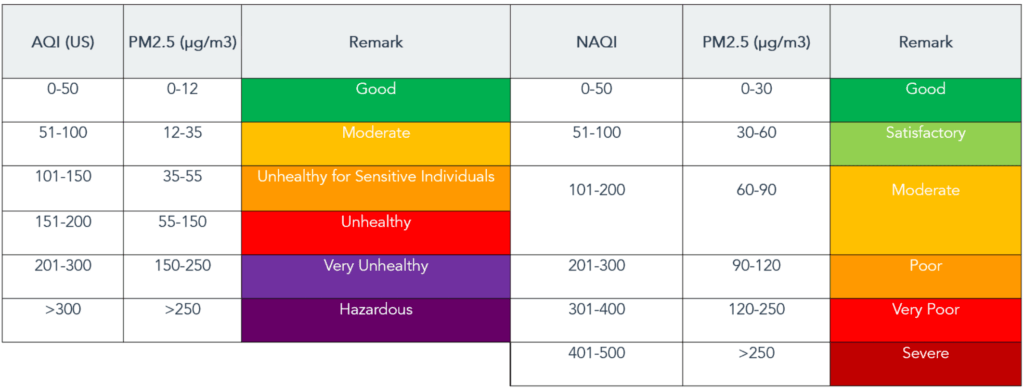
As you can see in the comparison above, ‘moderate’ air quality as per the EPA AQI scale is considered ‘good’ on the NAQI. This continues down the scale, as we see ‘unhealthy’ is only ‘moderate on the NAQI. However, the indexes begin to align at higher concentrations, as we see the brackets for ‘very unhealthy’ and ‘very poor’ and ‘hazardous’ and ‘severe’ are very similar, if not the same – at least when it comes to colours and labelling, not the AQI values.
Before concluding this section, it is worth noting that the EPA AQI and NAQI scales significantly differ from the WHO air pollution guidelines. The WHO states 5μg/m3 is the long-term (annual) exposure ‘safe’ level for PM2.5, whereas 15μg/m3 is the short-term (24-hour) guideline. In India, up to 30μg/m3 is considered ‘good’; in the U.S., up to 12μg/m3 is considered ‘good’.
Okay, we know the indexes differ now, but what is the takeaway? Well, here are the essential key points for this section:
- AQI scales are different, and the Indian National Air Quality Index is no different. You should familiarise yourself with the differences.
- View individual pollutant concentrations instead of the air quality numbers, colours, and remarks to compare scales.
- The NAQI generally has higher thresholds for particle concentrations, so be aware the ‘moderate’ according to the NAQI is ‘unhealthy’ on the U.S. EPA AQI.
- Both scales are far less stringent than the WHO air quality guidelines, which list 5μg/m3 and 15μg/m3 as the ‘safe’ annual and 24-hour exposures, respectively.
- When viewing air quality data, confirm which scale you are checking. Many apps and websites will allow you to select the air quality index you want to use.
How to Check Air Pollution in India
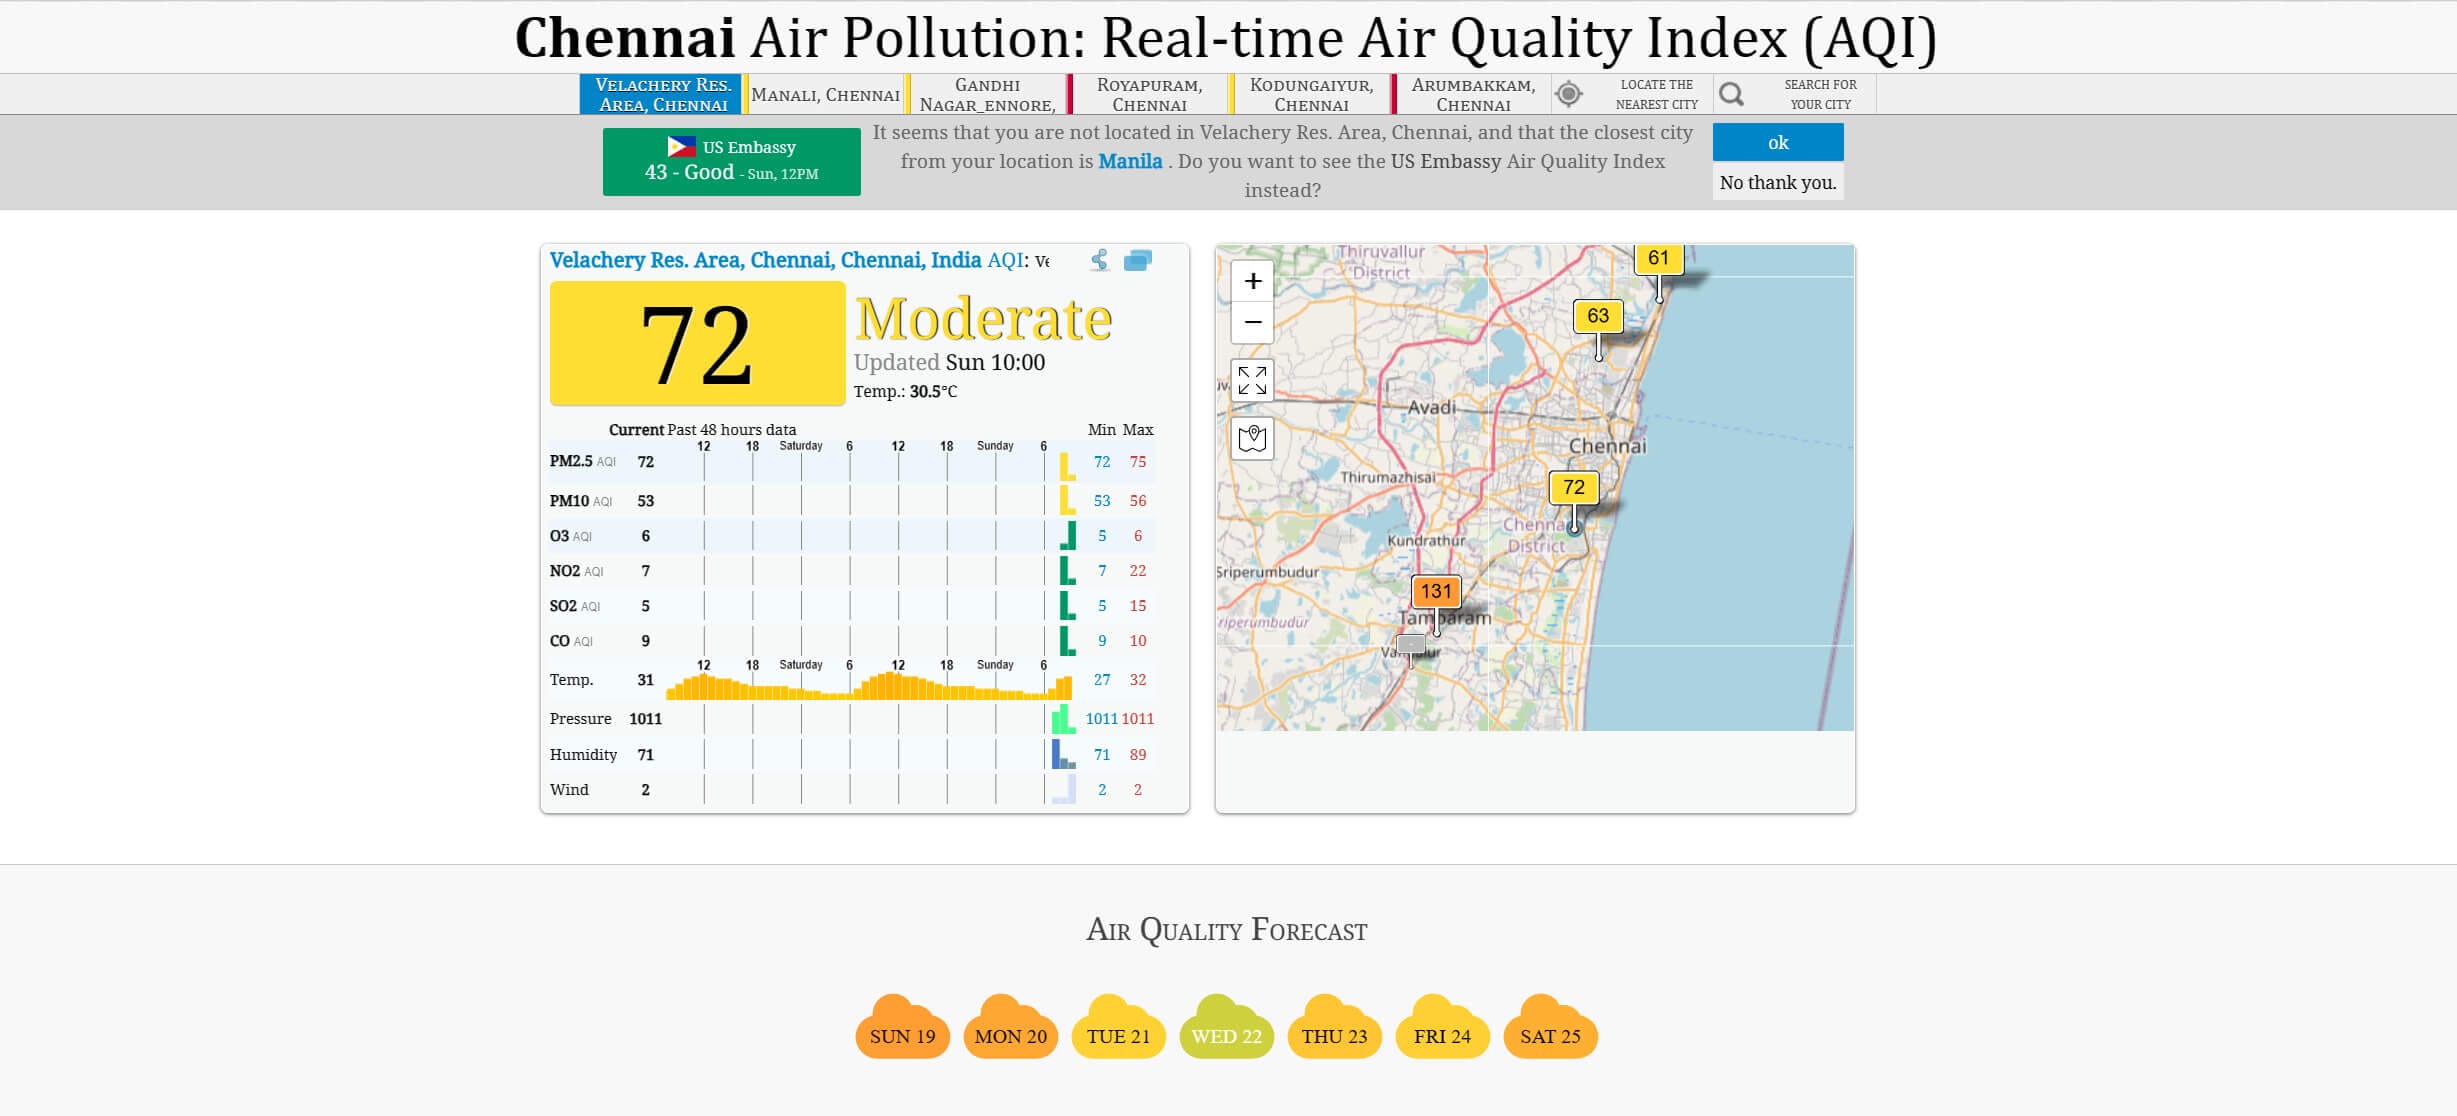
Air quality overview from AQICN.
When checking air pollution levels in India, your best bet is to download an app or bookmark an air quality website. There are many options out there – so many, in fact, that I dedicated an article to the best air quality applications. However, where I usually recommend AirVisual and AQICN, there are a few caveats regarding India.
Before discussing the best ways to check air pollution levels in India, I want to remind everyone reading this article to double-check the air quality index their app/website of choice uses. As we’ve just discussed, there is a huge difference between the U.S. EPA AQI, NAQI, and other AQI scales. If you’re comparing across apps/websites, it’s possible that the information won’t be directly comparable as these scales differ significantly.
Since India has a well-known air quality issue, the government has taken steps towards ensuring that locals and visitors alike can view the air quality data in their regions, cities, and, sometimes even, neighbourhoods. That said, I was surprised at the lack of local air quality monitors when I checked the maps on AirVisual and AQICN.
I usually recommend these two air quality applications as they are both easy to use and understand, provide accurate data, and offer in-depth details (such as individual pollutant concentrations) if you want to view them. Unfortunately, while these platforms work in India, the data can be limited depending on where you live or visit. For example, if you go to New Delhi, Mumbai, or any other major city, they will likely have monitors. They also have good coverage of southern India.
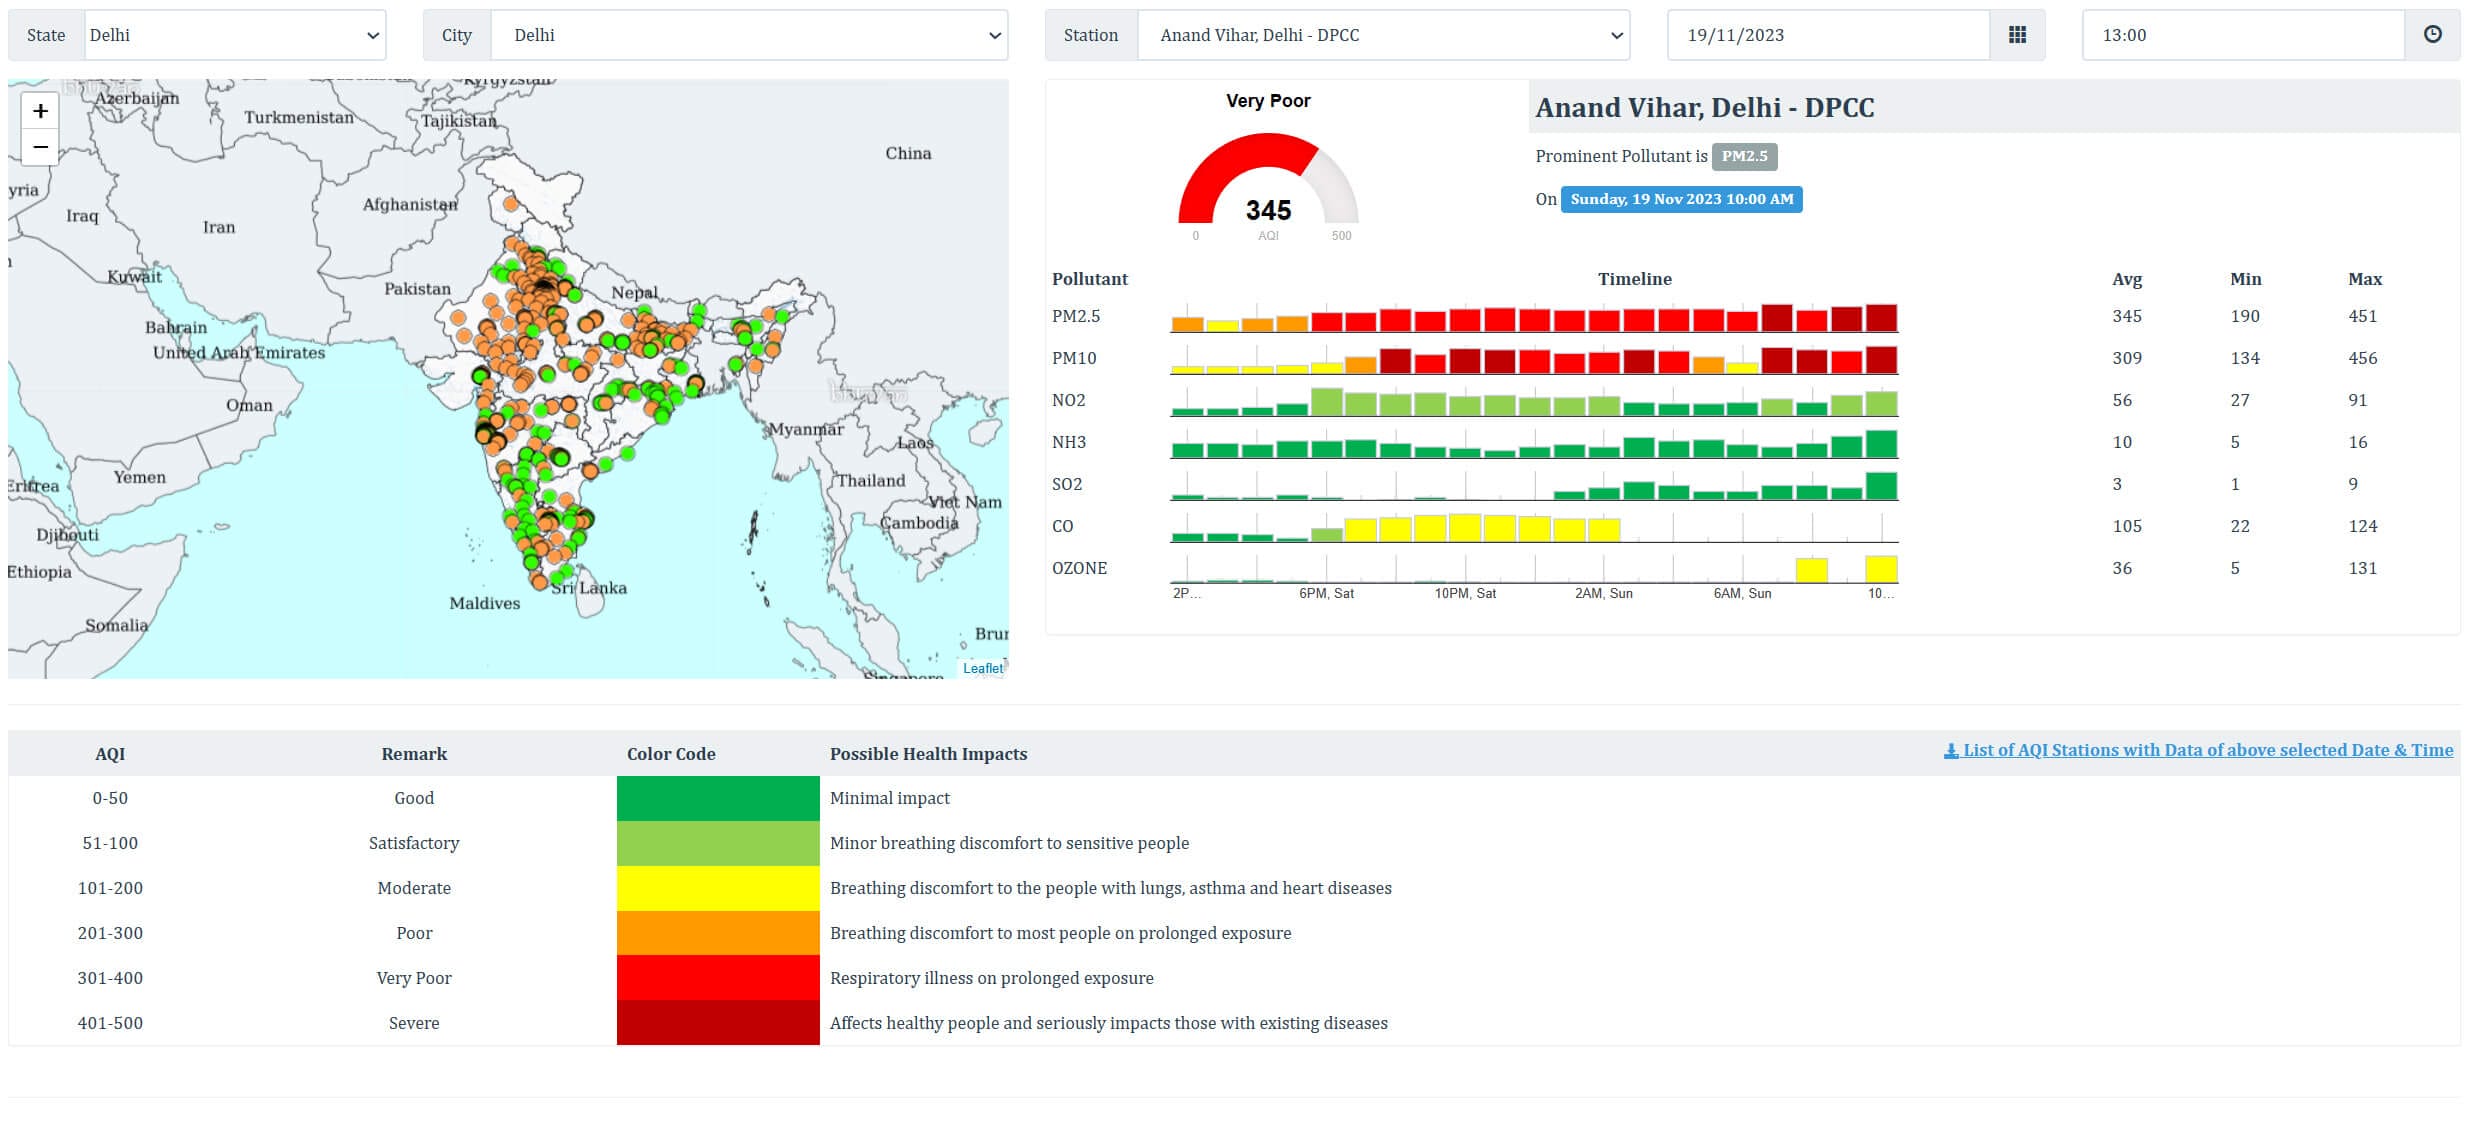
The National Air Quality Index site from the Central Pollution Control Board has much more information due to having more monitored locations.
If you are visiting smaller cities or are based primarily in northern India, these platforms have limited data, and I don’t recommend using them while you are in India. Instead, I recommend a platform such as AQI.in. This website has more data and allows users to quickly swap between the U.S. EPA AQI and NAQI, depending on your preference. However, remember those differences between the scales as they are key!
The Central Pollution Control Board also manages an AQI map found here. However, while there is no doubt that this platform has the most information, I found it frustrating to use. The loading times aren’t ideal, and I hate entering a CAPTCHA every time I use the map. On top of this, I find the UI more confusing than platforms such as AQICN, AirVisual, and AQI.in. There is no doubt, though, that if you’re in a smaller city or region, this website is your best bet for air quality data.
If you are looking for historical data, the Central Pollution Control Board’s website has a wealth of information. Select an individual sensor, and you can view the sensor data from over a year ago. Again, I don’t particularly like the UI, and I think AQICN is slightly better for this function – especially if you want to check seasonal air pollution patterns in India.
So, what app/website would I recommend for checking the air quality in India? Well, it comes down to your location. In a large city, you can rely on the platforms I usually recommend – AirVisual or AQICN. If you already rely on AirVisual in other countries, there’s no need to download another app to view the air quality in India! With that said, if you are leaving the major cities and you can’t find data on those two platforms for the location you are visiting, you will want to check out AQI.in and the CPCB website.
How Can I Interpret the AQI in India?
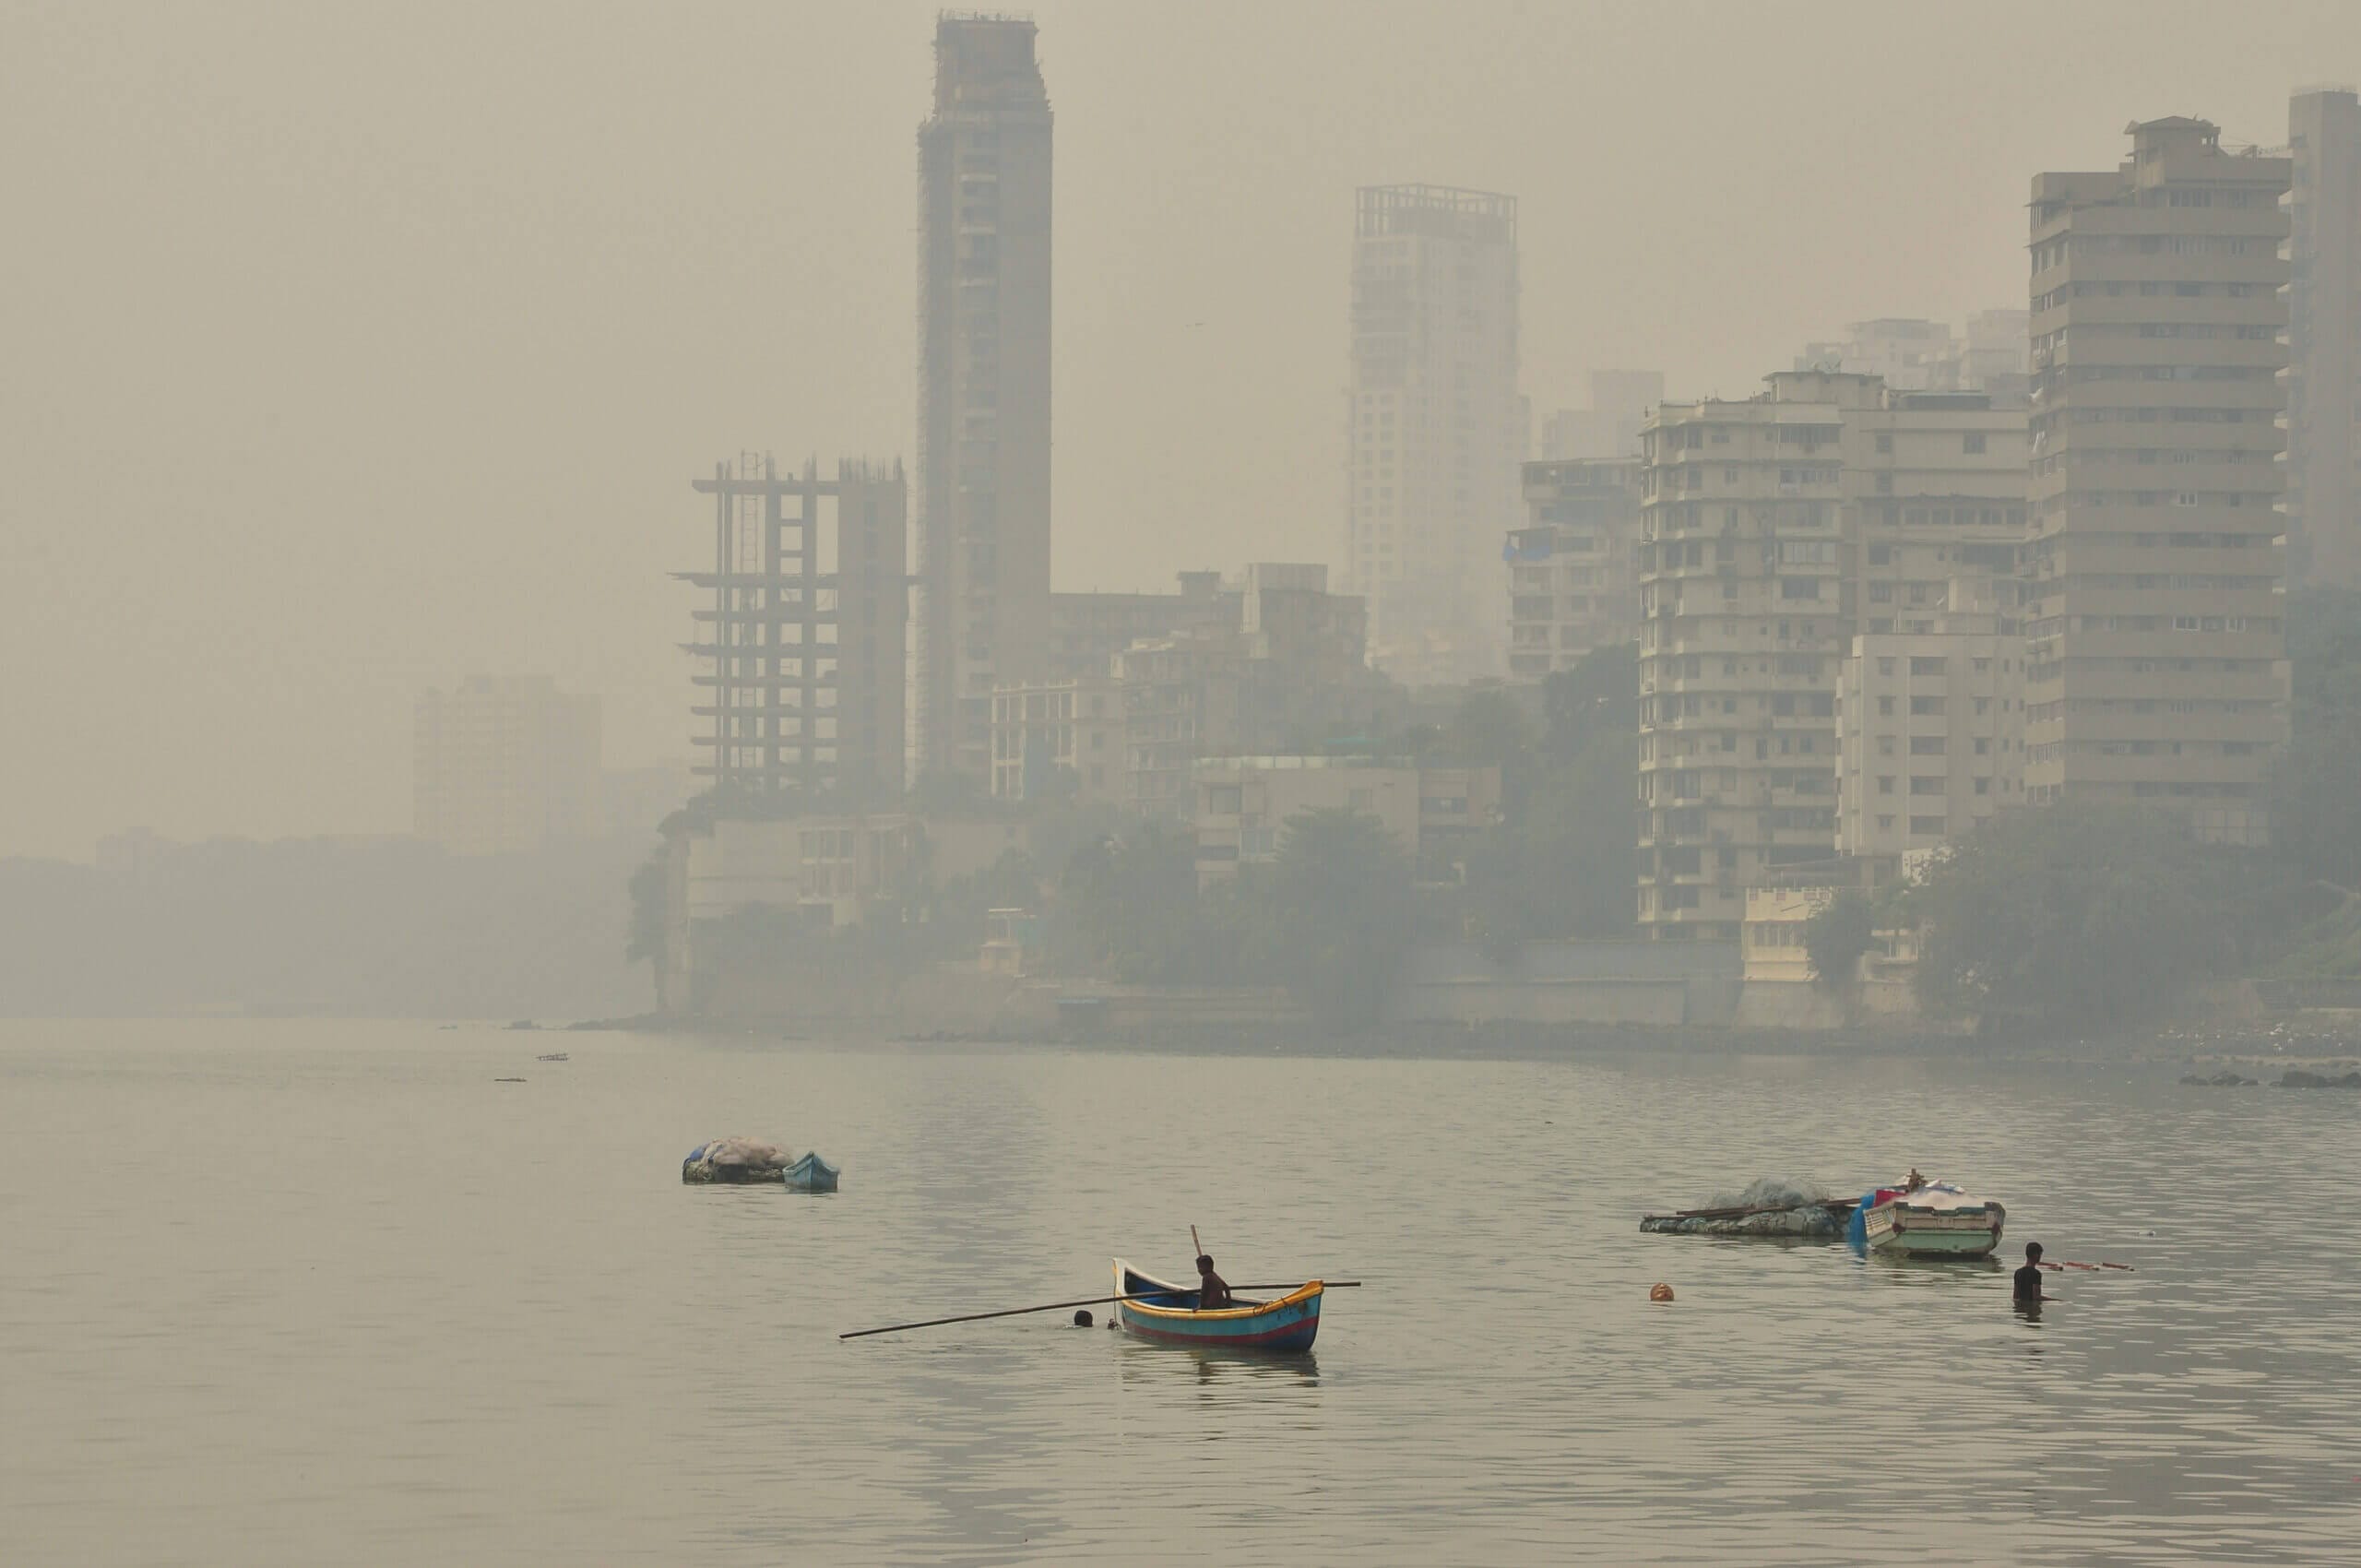
While being able to read the air quality index and understand the meaning of the numbers shown is important, even more important is knowing how you can act accordingly and protect yourself from air pollution. However, before discussing what actions you should take at what AQI, I want to bring a few points to your attention.
- Everyone has different tolerances and sensitivities. There are recommendations I can make, but everyone has different sensitivities to airborne pollution. Furthermore, not everyone wants to wear a mask at ‘only’ 100 AQI. While I would highly recommend it, each person has a different threshold. After reading this article, you know how air pollution affects your health, so it’s up to you to take the actions you feel you need to protect your health. Remember, no level of air pollution is safe.
- I will use the U.S EPA AQI in this section as that is the most-used index globally, and it’s the scale most readers will already know.
- I am aware that it’s not always possible to avoid air pollution. While the advice to ‘stay inside’ is true, it’s not always possible. Take whatever precautions are possible for you.
So, what actions should you be taking to avoid the worst of the air pollution in India? Well, that depends on the air quality on any given day. You should always check the air quality regularly, and I recommend putting an air quality widget on your phone’s home screen if possible. This is the best way to constantly be reminded of the air quality without needing to remember to open the app. Personally, I have an AirVisual widget on my Apple Watch that I can see every time I glance at it.
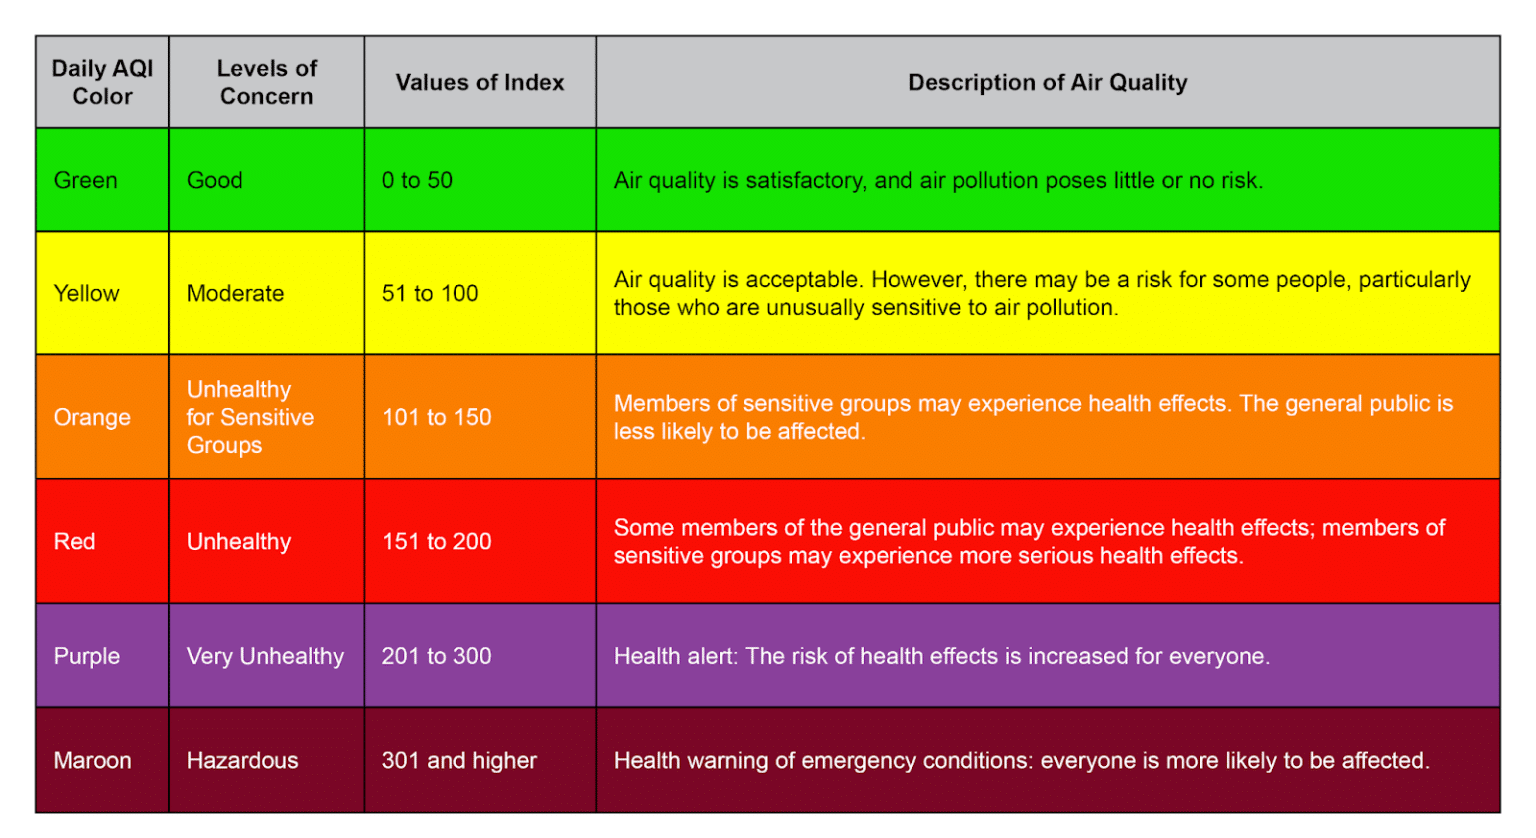
Image source: Idaho Department of Environmental Quality
Above is a U.S. EPA AQI table showing the AQI colour, level of concern, index values, and a description. As you can see, no actions are needed on days when the AQI is 0-50 (green). However, once the air quality reaches 51-100 (yellow), some sensitive groups will begin to feel short-term effects such as exacerbated asthma.
The general public generally begins to feel the effects of air pollution once the AQI surpasses 100 (orange). From experience, it is also at this level when the poor air quality becomes visible, and you can see a haze when looking at buildings in the distance.
After 151 (red) on the AQI scale, everyone’s health starts to be impacted, and the impacts are worsened as the air quality deteriorates to purple and maroon colours. At these levels, everyone should be doing everything they can to minimise the impacts of air pollution on their health and wellbeing.
How Can I Protect Myself from Air Pollution in India?
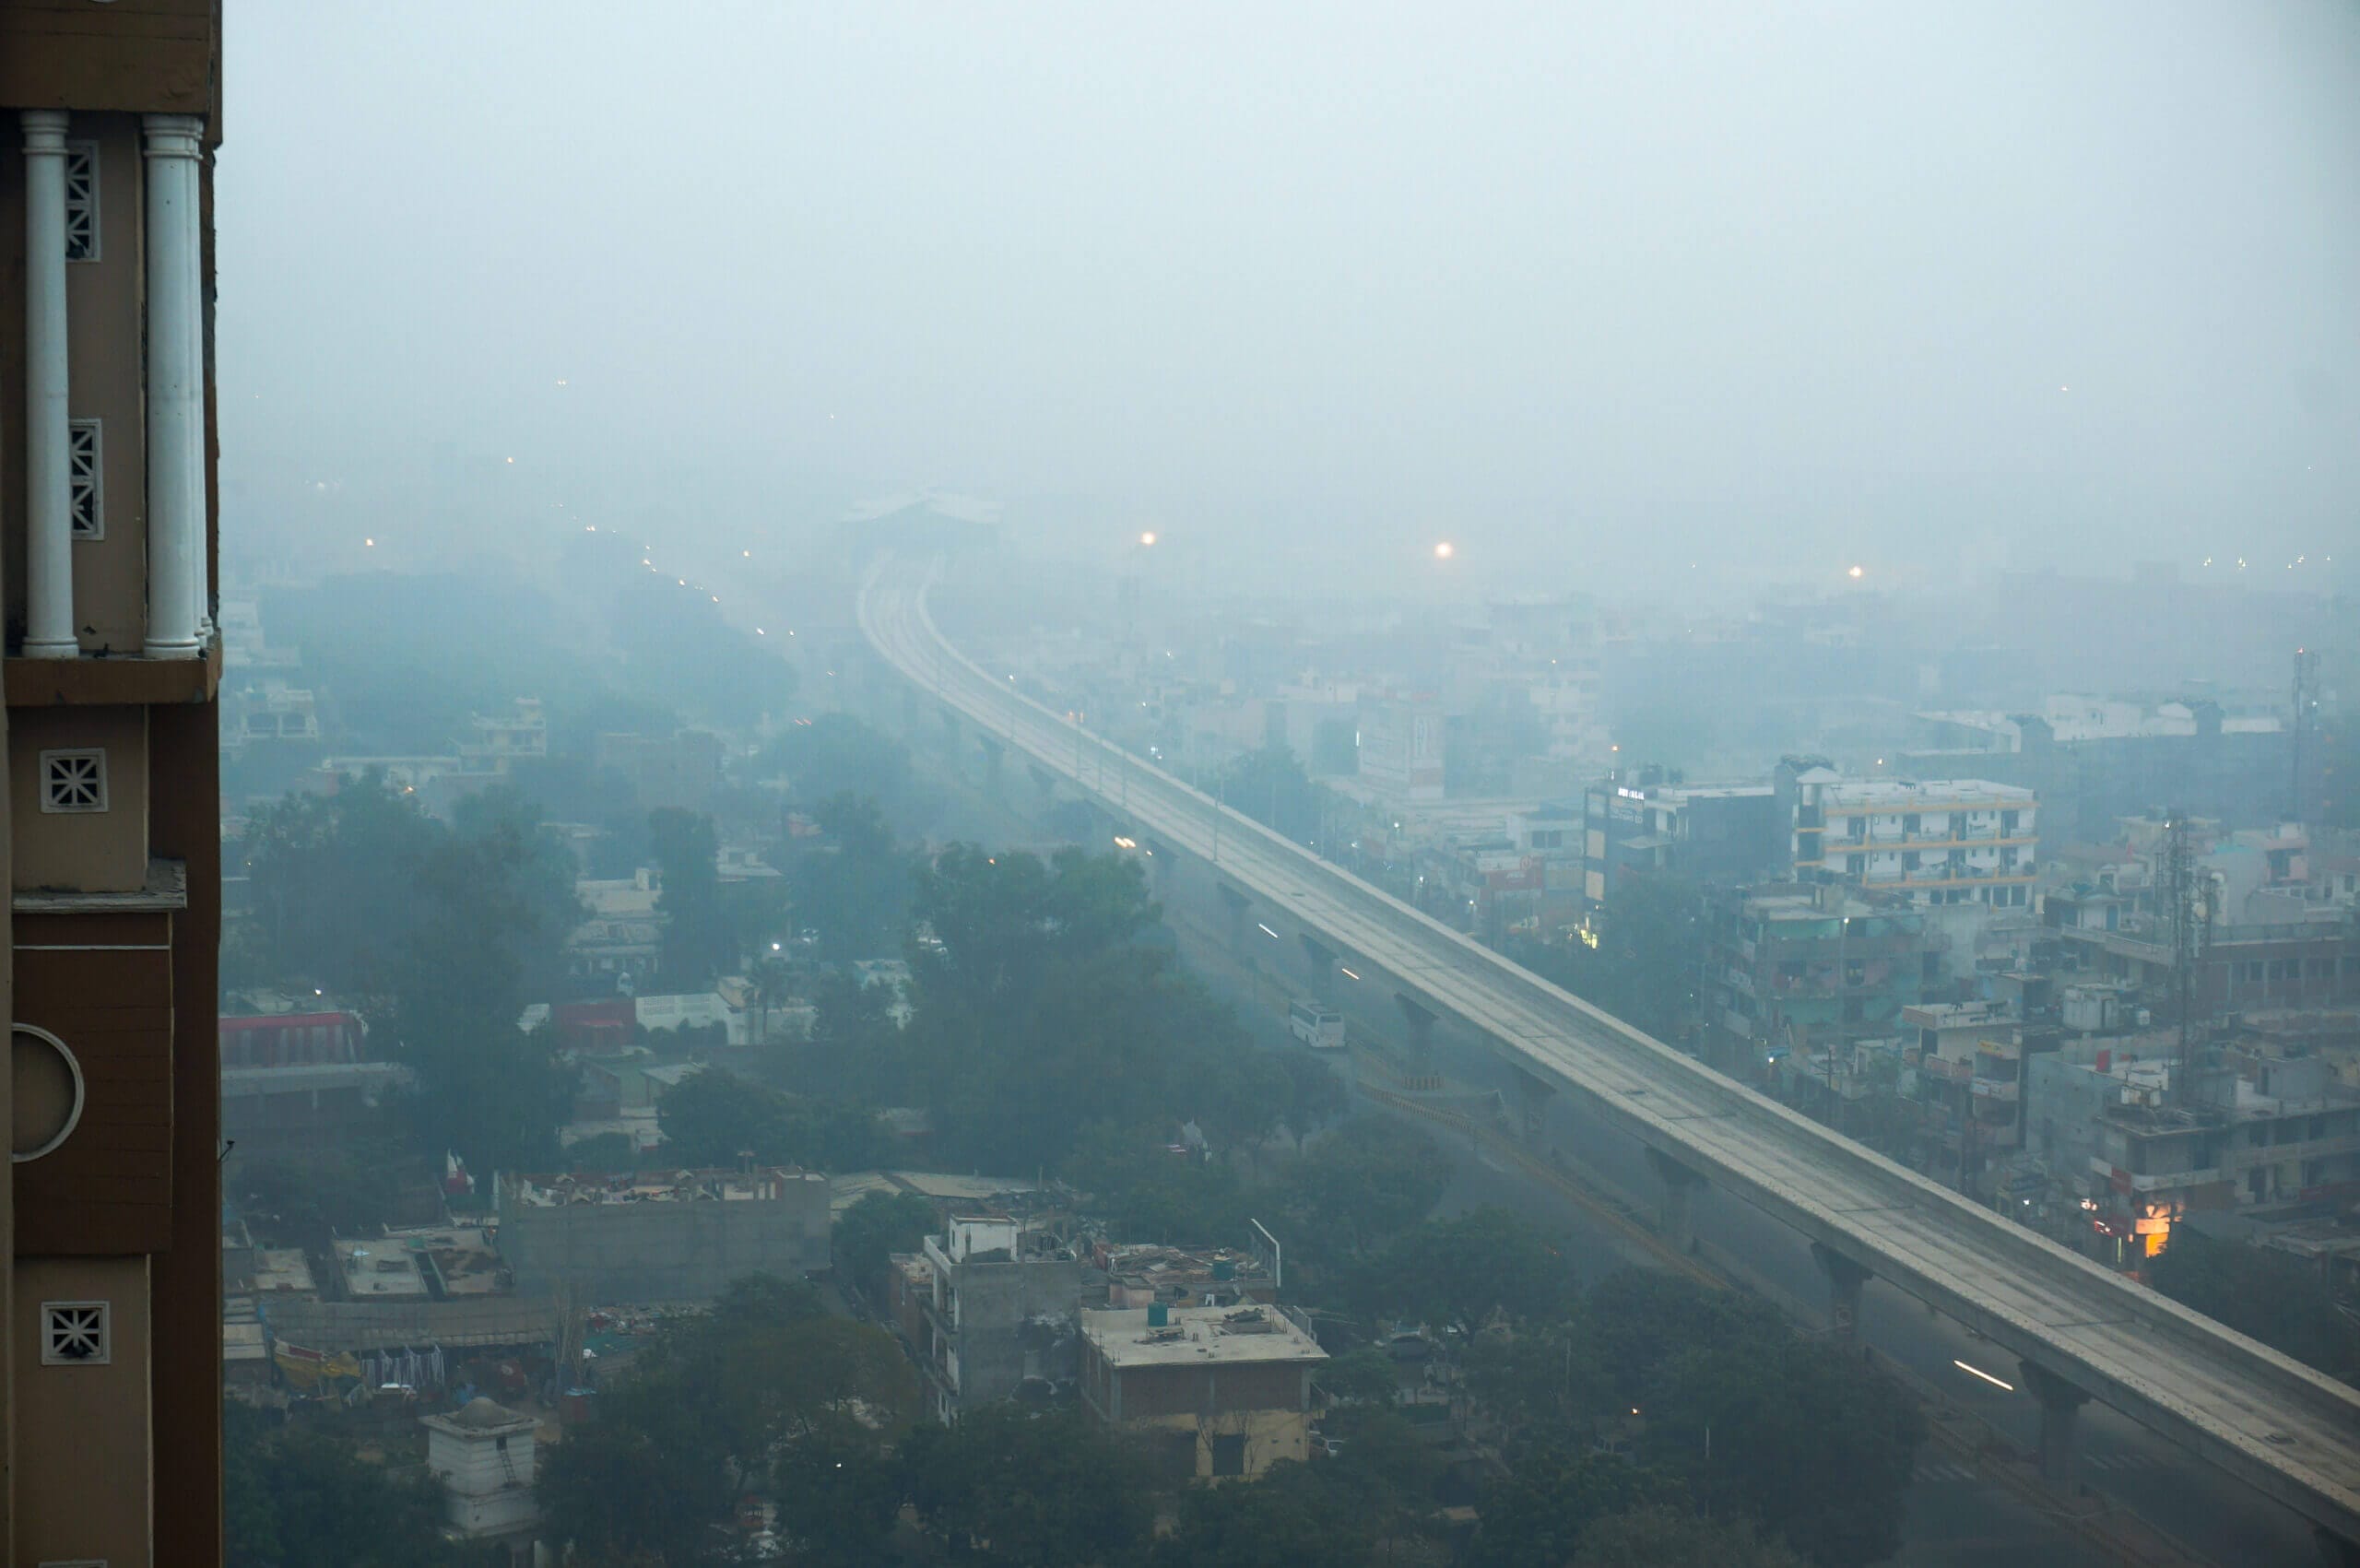
That brings us to perhaps the most important section of this article. We’ve now discussed in detail what causes air pollution in India, how it impacts human health, where it originates, and how to identify and monitor local pollution levels. However, none of this information is particularly useful unless you know what actions you can take to keep yourself and your loved ones as safe as possible. Let’s take a look at the steps we can take.
Check the AQI Regularly
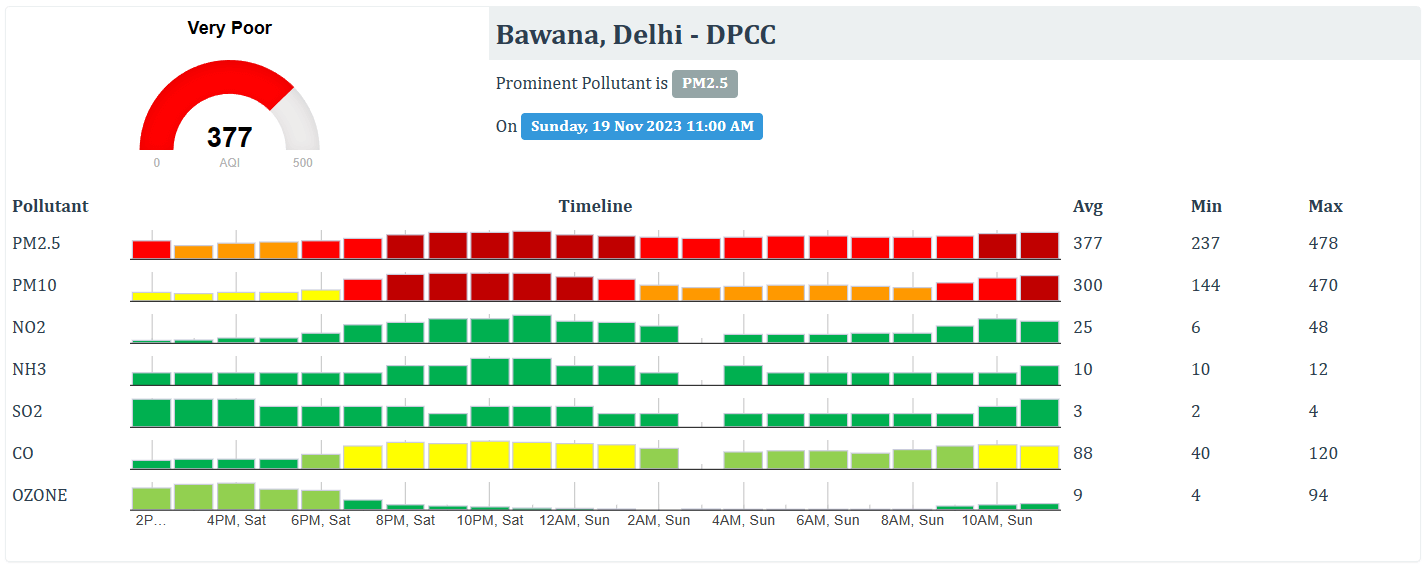
The first step is to check the AQI regularly throughout the day. You might be used to checking your preferred AQI app every morning, but that’s not enough. Air quality can rapidly change; you should check it every few hours if possible. The best way to do this is to add a widget to your smartphone’s home screen so you can easily see the AQI every time you unlock your phone.
To make this process painless, I recommend either allowing the app to use your GPS (so it can provide data from the closest monitor) or manually setting a monitor from which you want to see data. This ensures you will always get accurate data relevant to you. Remember, even within a city, air pollution can vary greatly and be surprisingly localised.
Avoid Going Outdoors
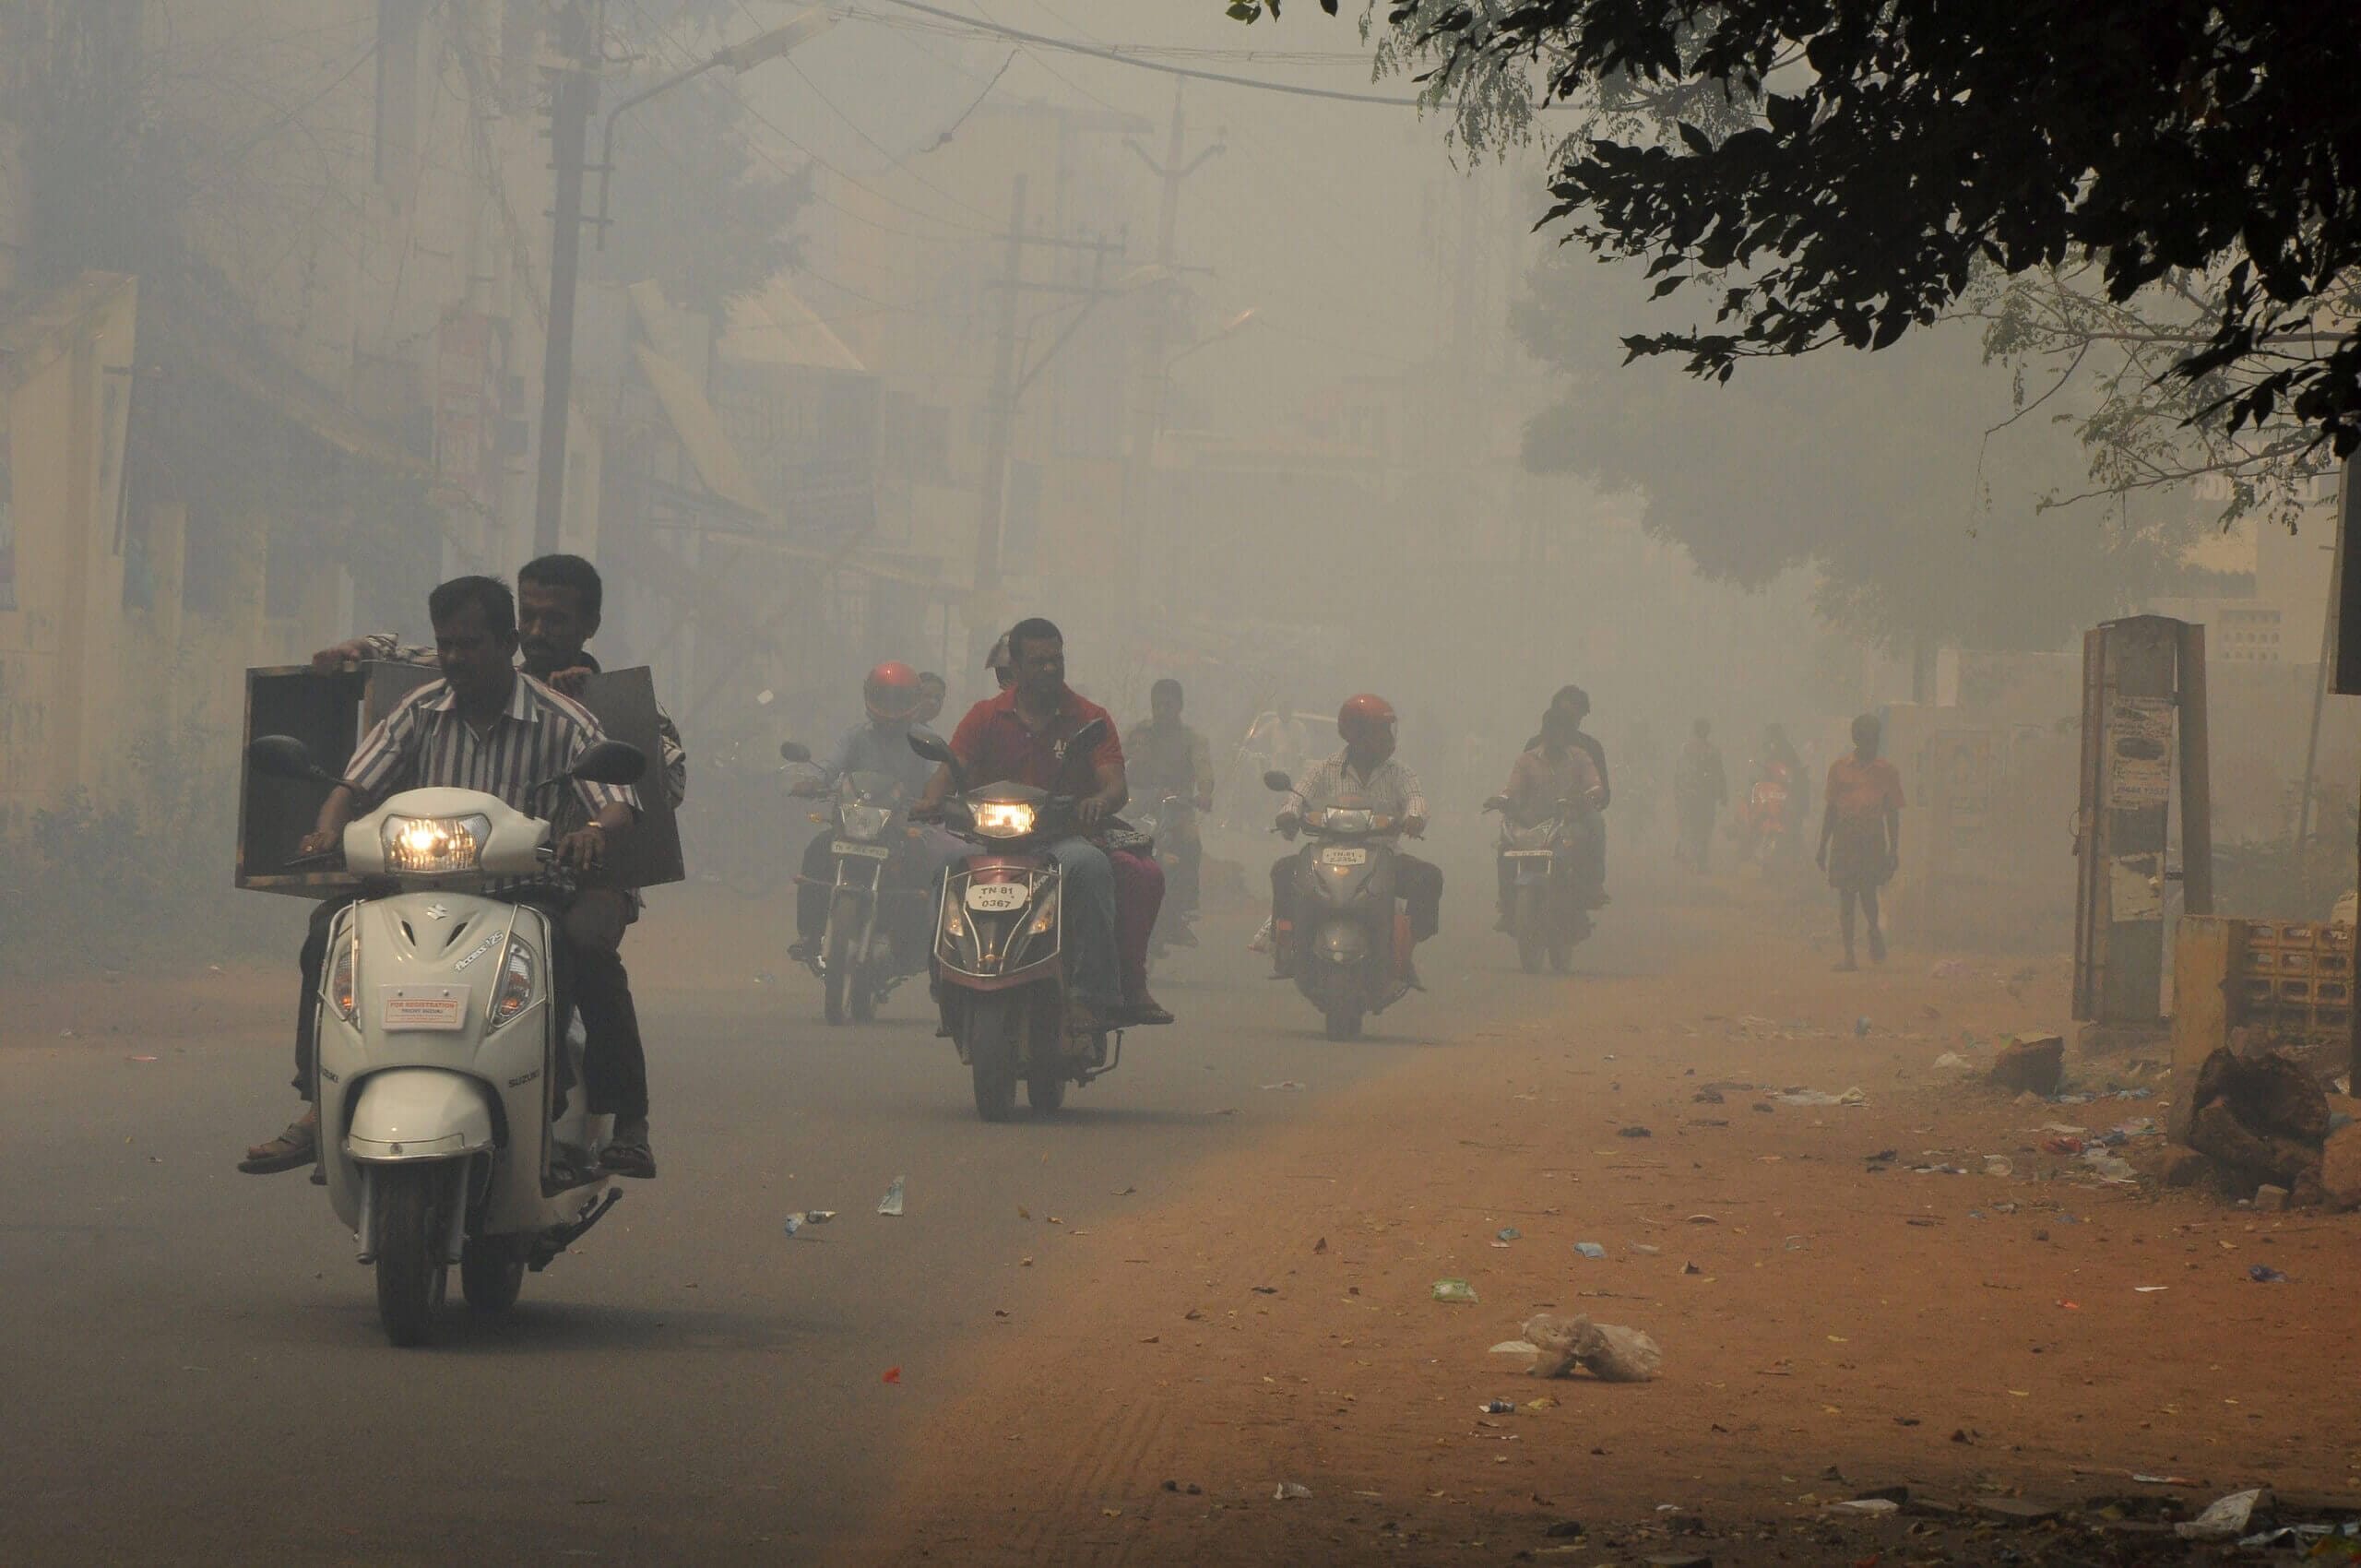
Okay, I know this isn’t always possible. However, if you wake up in the morning and check the AQI before heading out only to see it’s 250, the best advice is not to go outside at all. Avoidance is always the best method of protection when it comes to air pollution, and in India, where the air pollution is so severe, this is especially true.
If you stay home, close the windows and block or remove any possible entry points for fine dust. If you have an extraction fan, be careful, as these are common entry points for fine particles. If you live in a house or somewhere with doors that lead outside, ensure these doors don’t have gaps around the edges. If they do, consider covering them with tape, clothes, or whatever you have on hand.
While staying inside is the best way to stay safe from air pollution, it’s not always possible. If you need to go outside, ensure you don’t exert yourself, as increasing your respiratory rate will lead to more inhaled particles. If you exercise outdoors, consider going to a gym or working out at home instead,
Also, there is one more important note here. While we must be careful to prevent outdoor particles from entering, ensuring you aren’t creating more particles inside and suffering from indoor air pollution is vital. Try to avoid cooking if possible, and, if needed, cook foods or use cooking methods that don’t generate smoke.
Wear a High-Filtration Respirator

While fit-testing is needed to find the best respirator for you, I recommend the 3M Aura as it has the best average fit.
Personally, I opt to wear a respirator when the AQI goes above 75. You may make a different decision. However, for most people, I would recommend masking when the AQI passes 100, and I believe it’s essential once the AQI passes 150. At this point, you can begin to ‘taste’ (it’s hard to explain, but it almost feels like you have very fine sand in your mouth) the air pollution, and respirators are essential.
Respirators are an entire topic by themselves, and I’ve researched and reviewed them extensively on this website. If you’re looking for a respirator to try, please feel free to check out my recommended respirators. In short, you will want to look for a respirator certified at least N95 or equivalent that fits you well. Where surgical and cloth masks have some use as source-control for viruses, they are useless against air pollution, and you will want to ensure you have a well-fitted respirator.
The world of masks and respirators can be complicated, so I’ve put together a post comparing the standards and the differences between N95, KN95, KF94, FFP2, and more. If you’re confused about how each respirator performs, I recommend checking out that post for more information.
Get an Air Purifier
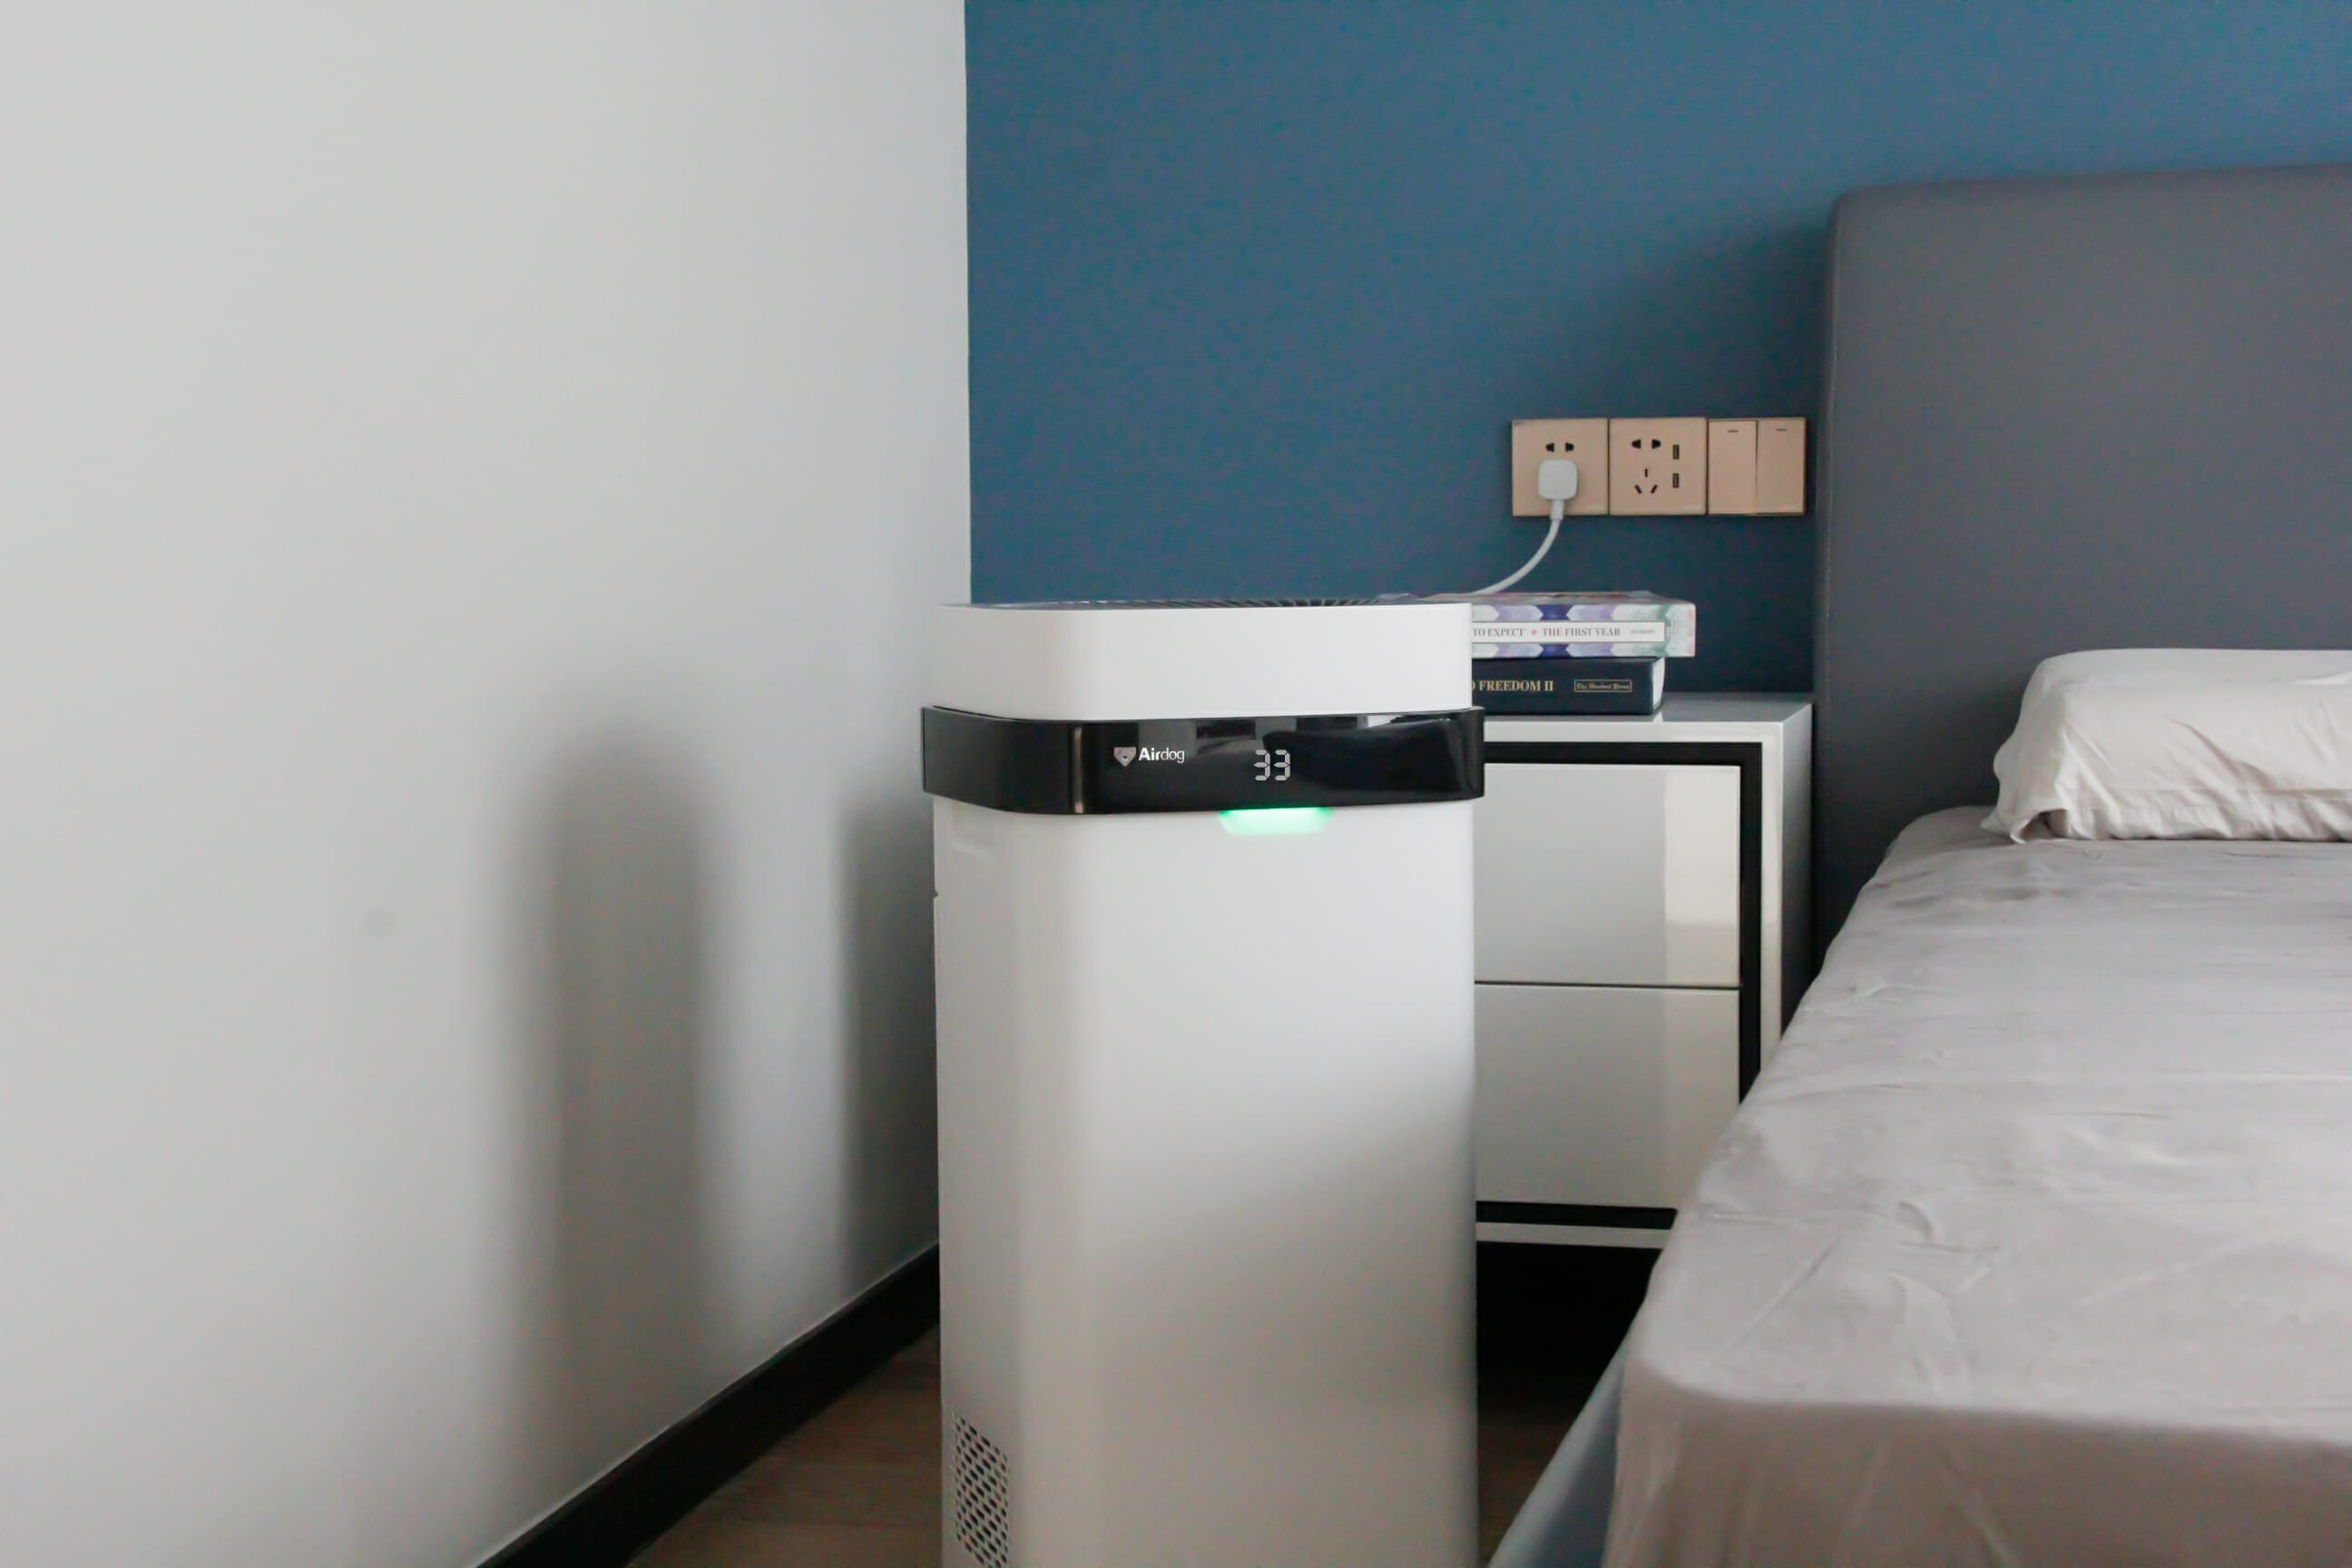
Many people don’t fully trust air purifiers, and with the number of faulty, sub-par and outright misleading air purifiers on the market, this distrust is valid. However, using the correct air purifier when needed can be a lifesaver. While we can take measures to ensure particles can’t enter our homes, I always find that some make it inside regardless. Whether they’ve entered on our clothes, through small gaps we can’t find, or even been carried in by a pet, they always find a way in.
In these situations, an air purifier is our only real option, as filtration is the only option to clean air outside of ventilation. Luckily, while some air purifiers are expensive, many inexpensive alternatives exist. Some of the best options come from SmartAir, which creates no-frills air purifiers to do one job – clean the air. Due to this, they’re inexpensive yet high-performance.
If you live in India, I highly recommend getting an air purifier, as air pollution isn’t an occasional issue. Instead, it’s an everyday issue for many months of the year, and, especially if you are in India for a more extended period, you don’t want to suffer from the health consequences caused by air pollution.
Get an Air Quality Monitor
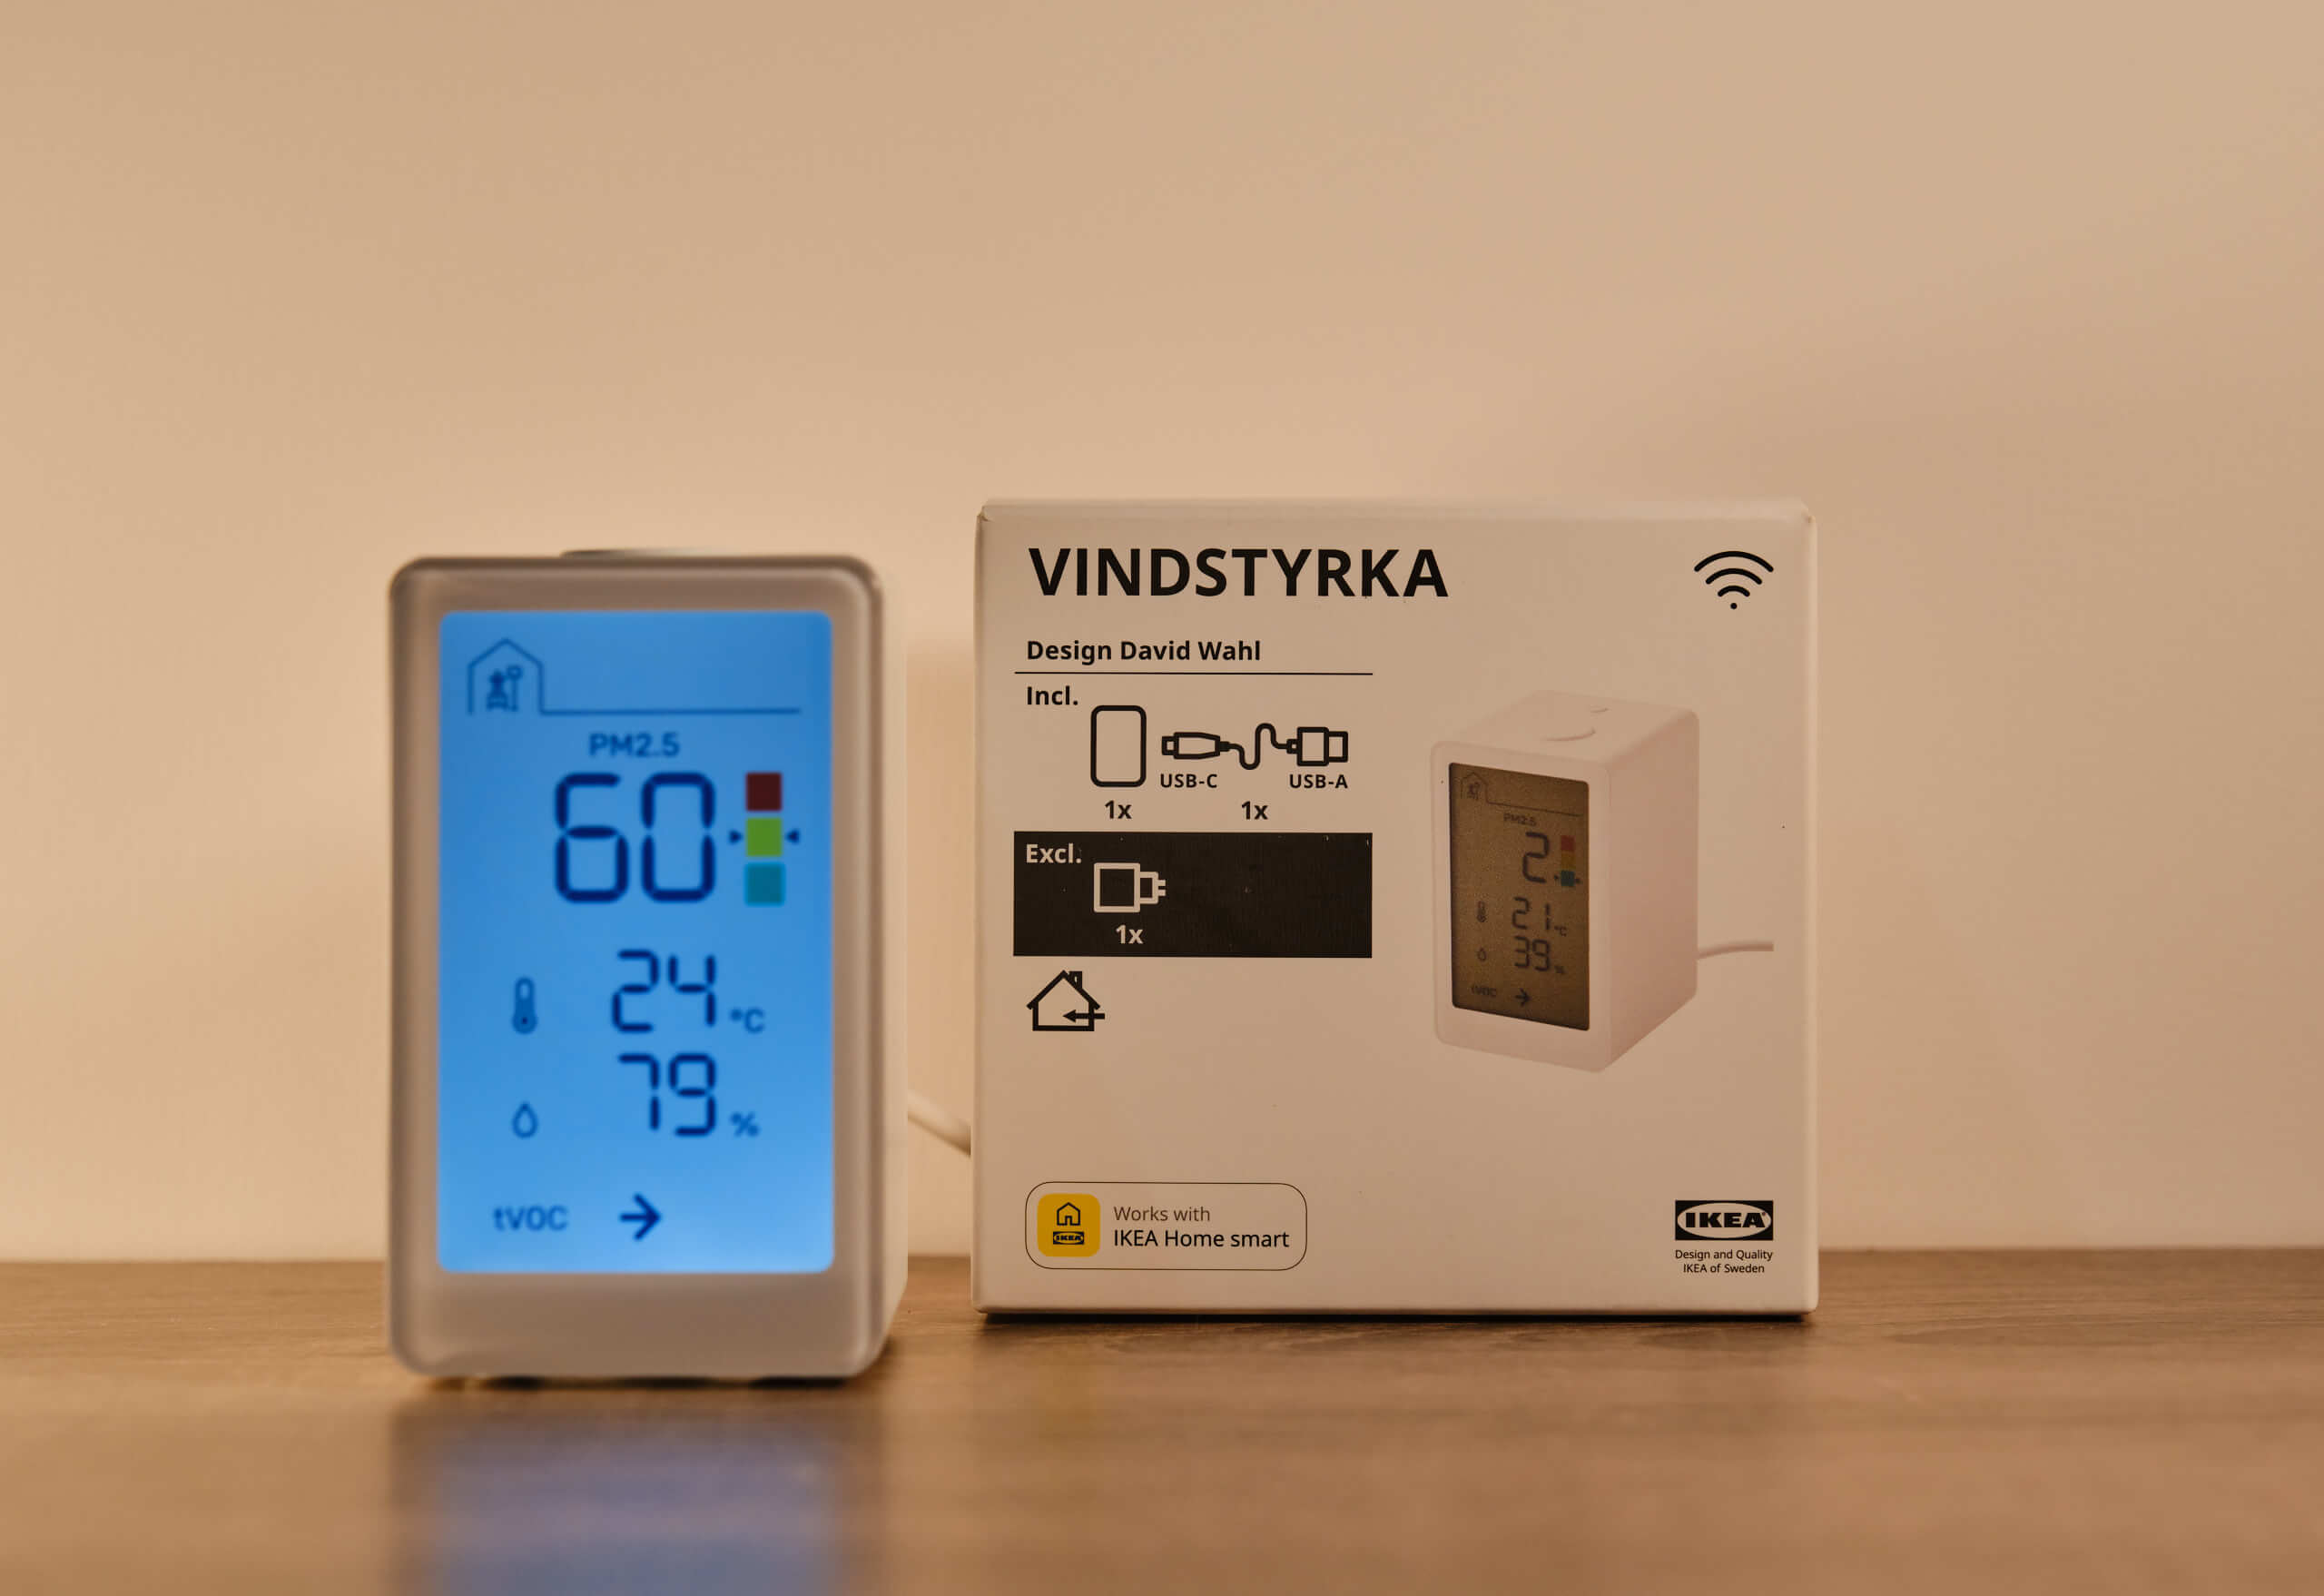
IKEA Vindstyrka Indoor Air Quality Monitor.
While air quality apps are great for checking the air quality in your city, unless you are in a major Indian city, there are likely no local monitors in your neighbourhood. Since air quality can vary greatly, even from street to street, a portable particle counter might be a good choice.
If you plan to leave the cities or are visiting or living in a city or town without air quality monitors, this recommendation becomes even more important. While portable air quality monitors aren’t cheap, they’re often the only option we have to monitor local air quality or monitor air quality in areas where there are no official monitors.
Also worth considering is an indoor air quality monitor. These monitors can be found at much lower prices than portable air-quality monitors, and there are models in every price range. If you have an air purifier, having one of these monitors is especially handy as it will let you know when you turn on the monitor.
Conclusion
India is a stunning country.
India is a wonderful country, and I had a great time exploring it. I enjoyed it enough that I’m already planning another visit, and I can’t wait to see more of what this fascinating country has to offer. If you plan to live or visit India, I recommend giving it a shot!
With that said, there’s no overlooking the issue of air pollution in India. While I don’t think you should cancel your trip to India because of it, you must know the dangers and how you can protect yourself. Even being exposed to such severe air pollution for a short period can have significant health consequences.
If you are already living there or planning to live in India, it’s worth seriously considering the issue of air pollution. While it depends on the city you will be based in, air pollution is generally a severe issue nationwide. If you have children or are pregnant, you will want to consider this even more seriously.
Unfortunately, 99% of the world’s population now lives in areas with air pollution exceeding the WHO guidelines. However, many areas in India exceed these guidelines tens or even hundreds of times over. I hope with the information provided in this post, you now know of the dangers of air pollution in India and the steps you can take to protect yourself from it.
Air Polluton in India FAQ
Is Air Pollution Bad in India?
Air pollution in India is some of the worst, if not the worst, in the world. It is a serious issue that needs to be considered whether you are just visiting, planning to live, or already living there.
Where Is Pollution Worst in India?
Air pollution in India tends to be worse in the north as the Himalayas prevent accumulated pollution from leaving.
When Is Pollution Worst in India?
Air pollution in India peaks during November to February.
Do I Need to Wear a Mask in India?
Yes. A high-filtration and well-fitting respirator is essential on many days.
Is Air Pollution in India Dangerous?
Yes. Air pollution in India decreases local life expectancy by as much as 12 years.
How Can I Check the AQI in India?
In a large city, you can use AirVisual or AQICN. If you are in an area that isn’t covered on one of these platforms, the CPCB website is your best bet.
Have Questions or Comments?
Join the discussion on the BreatheSafeAir Community Forum. Ask any questions you have about air quality or adjacent topics and get quick answers!